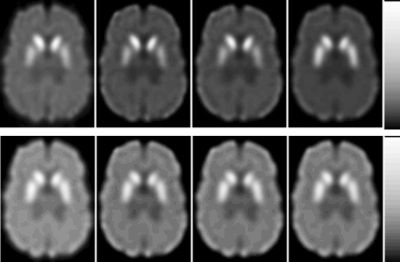
Figure 3.
Reconstructed images from different crosstalk∕downscatter compensation methods after ten iterations. From left to right, the images were reconstructed using OSEM-None, OSEM-Single, OSEM-altMBCC, and OSEM-simMBCC, respectively. Top row shows 99mTc images from distribution I and the bottom row shows 123I images from distribution IV. These distributions were chosen because they represent the worst case for the two isotopes.

