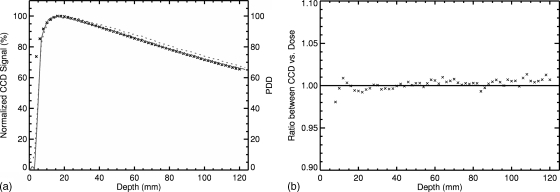
Figure 7.
PDD inside the LS material for a 5×5 cm2 field. The uncorrected measured light signal is shown as the dotted curve, while the solid line represents the corrected measured light signal by the CCD camera. The dose distribution obtained from the treatment planning system is plotted as cross hatches. Left: PDD from 0 to 120 mm. Right: Ratio between CCD signal and calculated dose.

