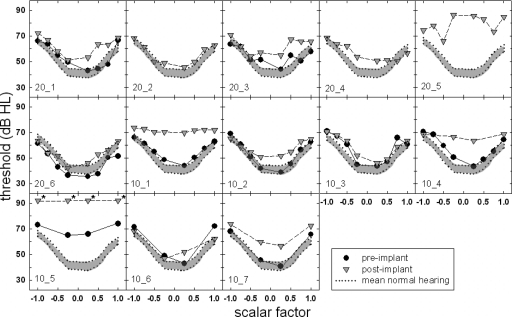
Figure 4.
Individual masked thresholds (in dB SPL) at 250 Hz for the implanted subjects. The filled symbols represent the preoperative condition, and the shaded inverted triangles represent the postoperative condition. The shaded area outlined by a dotted line encompasses the area of the mean masked thresholds and a +2 standard error for the normal-hearing listeners.

