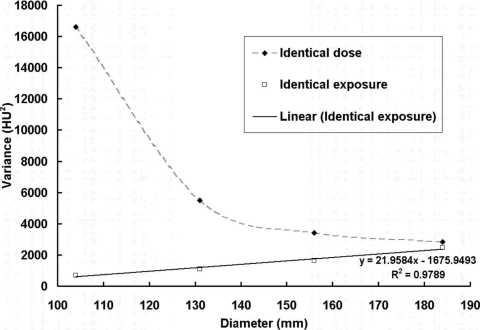
Figure 16.
BCT image variance with different object sizes. Image variance is shown as a function of the object diameter under two different scan situations shown in Figs. 1314. A linear fit was applied to the data points with identical exposure. When the exposure level (tube current or air kerma used for scan) is kept constant, the image variance has a linear relationship with object diameter.

