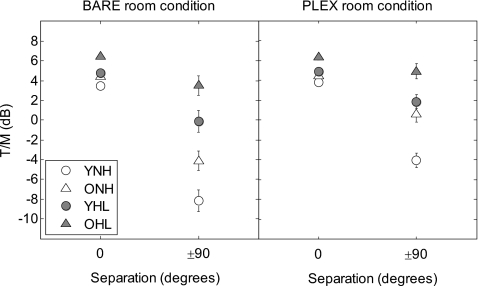
Figure 2.
Target-to-masker (T∕M) ratio (expressed in decibels and computed relative to the level of individual maskers) at threshold in the two separation conditions (0° and ±90°) for each listener group. The error bars are ±1 standard error of the mean. The left panel contains results from the low-reverberant (BARE) room condition and the right panel shows results from the more reverberant (PLEX) room condition. Hearing status and age are denoted as shown in the symbol key.

