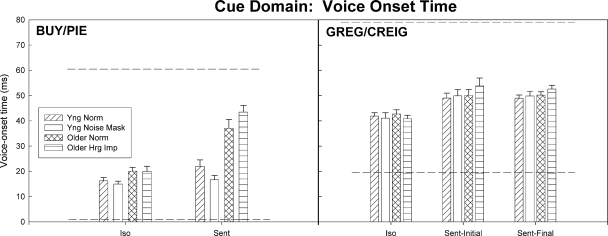
Figure 2.
Mean crossover points (in ms) for the VOT cue for the four listener groups measured in two continua (buy∕pie and Greg∕Creig) presented as isolated words (Iso) and in a sentence context (Sent) for the buy∕pie continuum, and as isolated words (Iso) and in a sentence-initial position (Sent-Initial) and in a sentence-final position (Sent-Final) for the Greg∕Creig continuum. Error bars show 1 standard error of the mean. The dashed horizontal lines indicate the minimum and maximum VOT values for the endpoint stimuli on each continuum.

