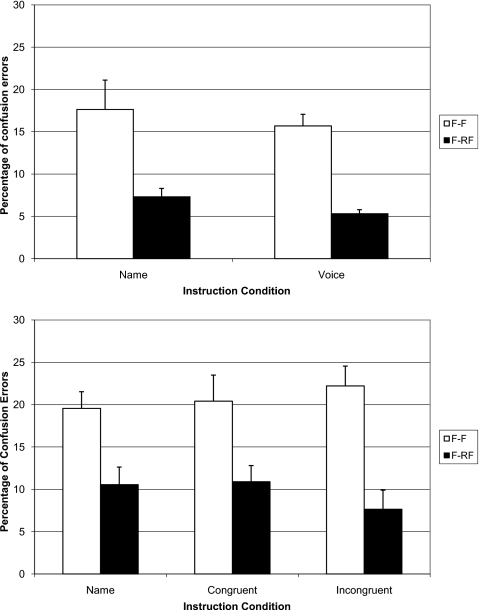
Figure 6.
Proportions of errors that involved responses from maskers in experiment 1 (top panel) and experiment 3 (bottom panel), aggregated by instruction condition in each study. Open bars represent performance in the F-F (spatially coincident) condition, and filled bars display performance in the F-RF (spatially separated) condition. Error bars represent the standard error.

