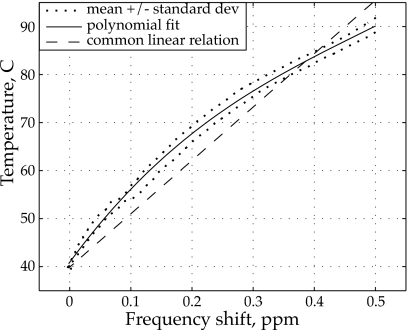
Figure 2.
Water proton resonance frequency shift calibration curve obtained in the 4.7-T magnet that was used for MR thermometry in present work. The solid line shows a third-order polynomial fit to the mean temperature as determined from 12 measurement points located near the center of the rf coil. The dotted lines show the mean ± standard deviation of the measurements. The linear conversion curve (dashed line) often used in 1.5-T magnets is also shown for comparison.

