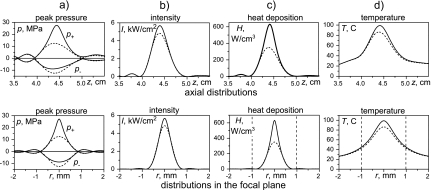
Figure 4.
Simulation results for acoustic and temperature fields in the phantom obtained assuming nonlinear (solid) and linear (dashed) acoustic propagations. Spatial distributions of the peak positive and peak negative pressures, intensity, heat deposition rate, and temperature after 7 s of HIFU exposure are presented axially (upper row) and in the focal plane radially (lower row). Dashed vertical lines on the heat deposition and temperature plots indicate the width of the voxel.

