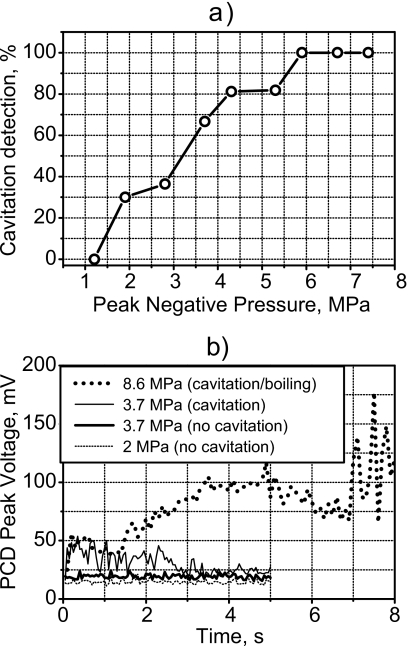
Figure 5.
(a) Percent of times in seven 5-s exposures that cavitation was detected versus peak negative pressure of the HIFU exposure. Cavitation was detected with a 20-MHz PCD high-pass filtered at 15 MHz. Peak negative pressures larger than 8 MPa were used in this work; therefore, cavitation was present in all experiments. (b) Peak-detected representation of time-domain trace recorded by the PCD for three HIFU exposure levels. At the lowest exposure (2-MPa negative pressure), the signal was at the noise level, which was 20 mV. An increase to 3.7-MPa negative pressure caused little change in one case and significant increase in signal amplitude in the other. The large increase in signal was attributed to broadband emissions from cavitation. Under the exposure used in the MR experiments (8.6-MPa negative pressure), the elevated signal due to cavitation was observed immediately after HIFU was turned on, and the signal further increased at 7 s when boiling occurred.

