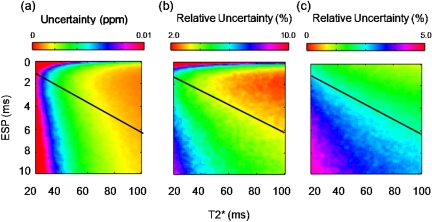
Figure 3.
Surface maps demonstrate the effects ESP and on a single-peak signal at SNR=20 have on the uncertainties for chemical shift (a), (b), and amplitude (c). Areas below the black line represent where the ETL . This causes an increase in uncertainty, which is more evident on (b) and (c). ESP>1.0 ms can provide low uncertainties as long as the ESP is short enough not to sample above the of the tissue.

