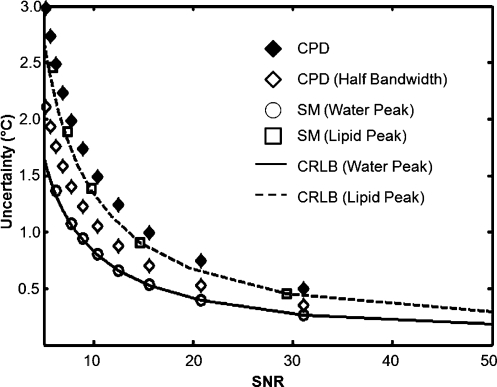
Figure 8.
The uncertainty in temperature versus imaging SNR for a signal containing 25% fat. The simulation (n=20 000 samples) for evaluating the uncertainty in the signal for water using the SM algorithm (circles) is compared with CRLB results (solid line). Note that our algorithm stays close to the CRLB over a wide range of SNRs. For reference, the CPD results are shown for an optimal TE at the same bandwidth as the 16-echo sequence (black diamonds) and at one half this bandwidth (white diamonds) as would more likely be used. This case also assumes that the CPD can perfectly remove the influence of the fat signal, which is unlikely; thus, it stands as a “best case” scenario for CPD against our technique. As can be seen, in addition to providing fat-water separation, the fast CSI approach easily outperforms the CPD approach across a large range of imaging SNR values for the same imaging time.

