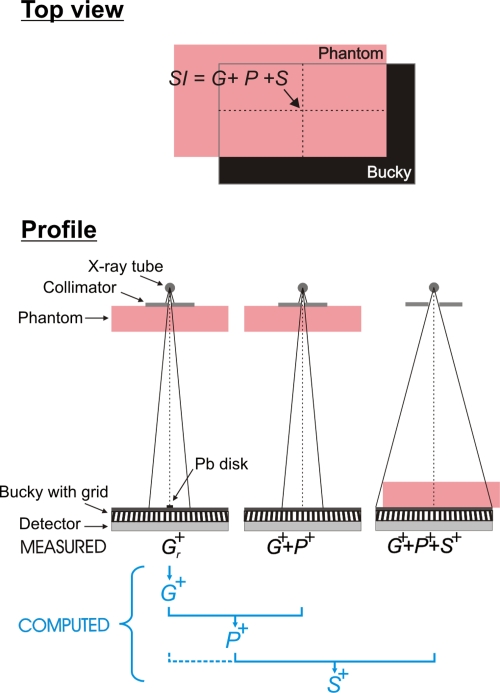
Figure 2.
(Top) Illustration of the breast tissue equivalent phantom positioned on top of the Bucky so as to simulate the MLO view. The contributions of glare (G), primary (P), and scatter (S) to the SI at the center of the irradiated phantom area were assessed. (Bottom) Illustration of the geometry for assessing G+, P+, and S+ in the presence of the antiscatter grid. G and S were extrapolated from signal intensities behind Pb disks of various radii r. All measurements were performed with the same mA s. G−, S−, and P− without antiscatter grid were acquired in a similar way.

