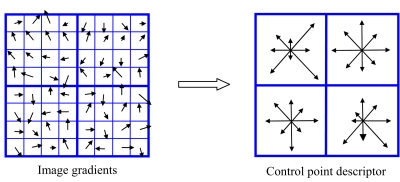
Figure 3.
A sketch of orientation histogram in SIFT method. The gradient of each of the 16 pixels in a quadrant is computed. An eight-bin histogram, with first bin representing the number of pixels whose gradients fall between 0° and 45°, and so forth, is then constructed. The histogram of each of the four quadrants is displayed schematically in the right panel as an eight-vector plot.

