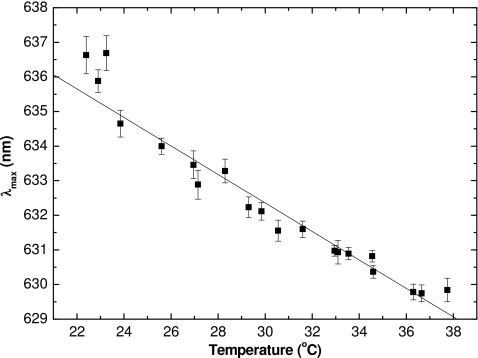
Figure 3.
Wavelength of maximum absorbance of films irradiated to 1 Gy as a function of measured temperature. For this and subsequent figures, 6 MV photons beams were used. The λmax was tracked from a few seconds after the beginning of irradiation, through to its end. The error bars represent the standard deviation of λmax over this time interval. The line is the linear regression fit to data (R2=0.955).

