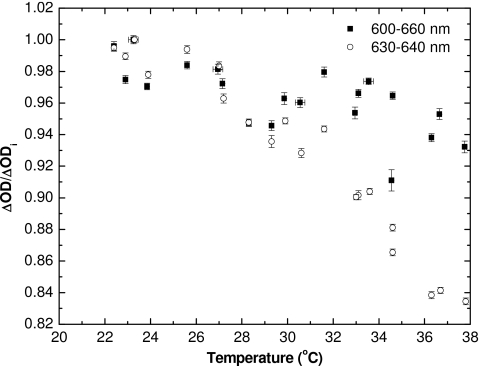
Figure 8.
Normalized ΔOD (with respect to ΔOD at ∼23 °C) vs temperature for the real-time measurements, performed within 5 s after the end of irradiation. The data are shown both using the 630–640 nm range for ΔOD calculations (circles) and the 600–660 nm range (squares). Error bars represent 1σ of a single ΔOD measurement and error in temperature readout.

