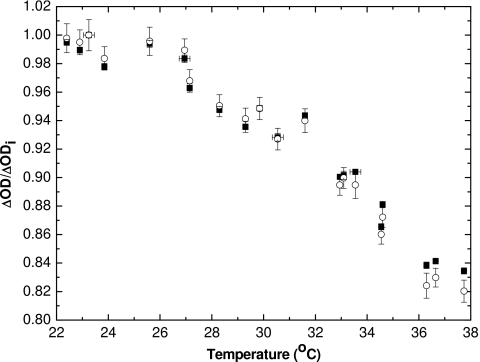
Figure 9.
Normalized ΔOD of real-time measurements. The method of calculating ΔOD used in this article is shown with squares (◼); the method described by Reinstein et al. (Ref. 30) of predicting ΔOD measured by a densitometer or scanner is shown with circles (○). Error bars represent 1σ of a single ΔOD measurement and error in temperature readout.

