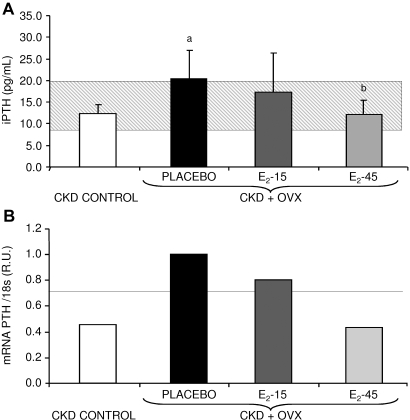
Figure 1.
(A) Serum iPTH levels of rats treated with placebo, E2-15 μg/kg body weight/d, E2 −45 μg/kg body weight/d, and the CKD-control group. aP < 0.05 compared with CKD-control group and bP < 0.05 compared with placebo group. The gray horizontal bar represents the range (mean ± SD) for the normal group. (B) PTH mRNA levels measured by quantitative real-time RT-PCR. R.U., relative units referred to the placebo group. The horizontal line represents PTH gene expression in the normal group.

