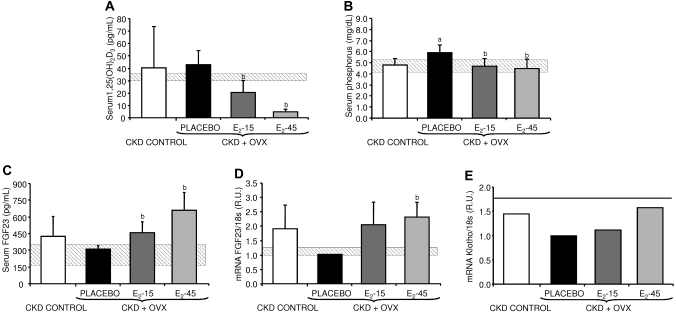
Figure 3.
(A) Serum 1,25(OH)2D3, (B) serum phosphorus, and (C) serum FGF23 levels in the CKD-control, placebo, E2-15, and E2-45 groups. aP < 0.05 compared with the CKD-control group and bP < 0.05 compared with the placebo group. (D) FGF23 mRNA levels measured by quantitative real-time RT-PCR from tibias of rats from the placebo, E2-15, E2-45, and CKD-control groups. R.U., relative units referred to the placebo group. aP < 0.05 compared with the CKD-control group and bP < 0.05 compared with the placebo group. The gray horizontal bars represent the range (mean ± SD) for the normal group. (E) Klotho mRNA levels measured by quantitative real-time RT-PCR. R.U., relative units referred to the placebo group. The horizontal line represents Klotho mRNA levels in the normal group.

