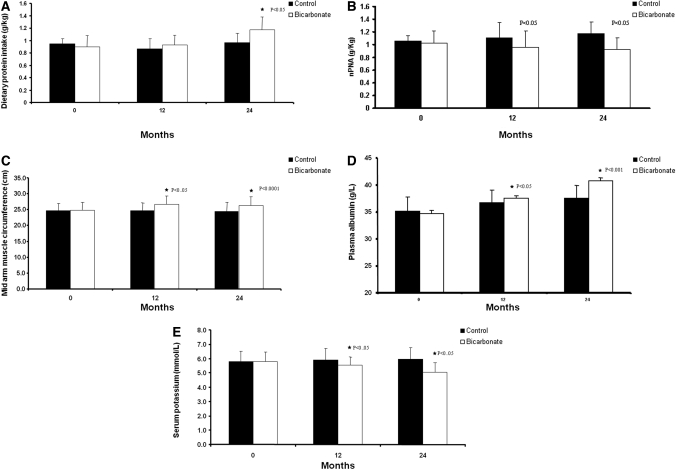
Figure 4.
(A) Dietary protein intake on 4-d patient dietary records. Data are means and SD. (B) nPNA during the study period. Data are means and SD. (C) MAMC measurements during the study period. Data are means and SD. (D) Plasma albumin levels in the control and bicarbonate groups during the study period. Data are means and SD. (E) Serum potassium levels in the control and bicarbonate groups during the study period. Data are means and SD.

