Figure 5.
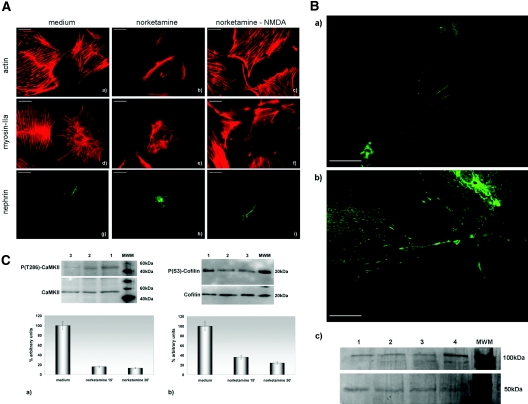
NMDAR in vitro blockade. (A) Effects on the cytoskeleton and nephrin expression. (a, b, d, e, g, and h) Compared with cells incubated with medium (a, d, and g), application of the NMDAR antagonist norketamine hydrochloride produces remodeling of the actin (b) and myosin IIA (e) cytoskeleton and redistribution of nephrin (h), which disappears from cell processes. (c, f, and i) The addition, after the antagonist, of the agonist NMDA, abolishes almost completely the agonist's effects. Phalloidin-TRITC (a through c); indirect immunofluorescence (d through i); bars = 50 μm. (B) Effects on NMDAR1 expression. (a and b) Compared with cells incubated with medium (a), addition of norketamine hydrochloride (b) determines an increased expression of the NMDAR1. Indirect immunofluorescence, bars = 50 μm. (c) Cells incubated with medium (lanes 1 through 3) express less NMDAR1 (band of approximately 100 kD) than cells treated by norketamine hydrochloride (lane 4). The lower band of 50 kD represents tubulin (loading control). (C) Downstream effects of the NMDAR blockade. Compared with cells incubated with medium (a and b, lane 1), phosphorylated CaMKII (a) and phosphorylated cofilin (b) are reduced, as compared with total CaMKII and total cofilin, after 15 (lane 2) and 30 min (lane 3) of treatment with norketamine hydrochloride. The graphs show a densitometric representation of Western blot results obtained from three experiments, where the ratio of lane 1 is taken at the arbitrary value of 100. Magnification, ×400.

