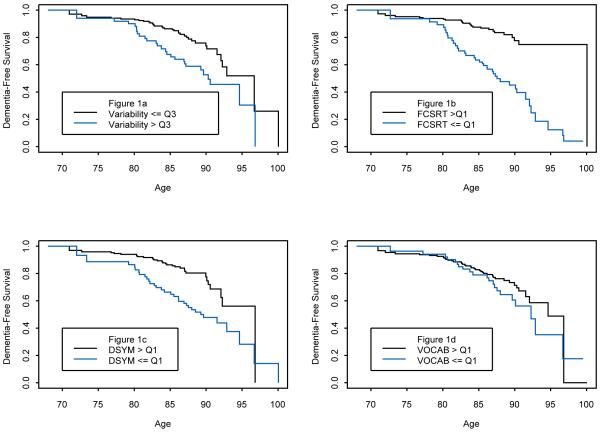
Figure 1.
a: Kaplan-Meier Curves for the Cumulative Risk of incident algorithmic dementia as a function of within-person across-neuropsychological test variability (highest quartile illustrated with a blue line versus the remaining three quartiles illustrated with a black line). Variability denotes within-person across-neuropsychological test variability; Variability > Q3 denotes highest (i.e., worst) quartile; Variability <= Q3 denotes remaining lower 3 quartiles
b: Kaplan-Meier Curves for the Cumulative Risk of incident algorithmic dementia as a function FCSRT performance (highest quartile illustrated with a black line versus the remaining three quartiles illustrated with a blue line). FCSRT denotes Free and Cued Selective Reminding Test; FCSRT > Q1 denotes highest (i.e., best) quartile; FCSRT <= Q1 denotes remaining lower 3 quartiles
c: Kaplan-Meier Curves for the Cumulative Risk of incident algorithmic dementia as a function of performance on the Digit Symbol Substitution test of the WAIS-R (highest quartile illustrated with a black line versus the remaining three quartiles illustrated with a blue line). DSYM denotes Digit Symbol Substitution Test; DSYM > Q1 denotes highest (i.e., best) quartile; DSYM <= Q1 denotes remaining lower 3 quartiles
d: Kaplan-Meier Curves for the Cumulative Risk of incident algorithmic dementia as a function of performance on the Digit Symbol Substitution tests (highest quartile illustrated with a black line versus the remaining three quartiles illustrated with a blue line). VOCAB denotes Vocabulary subtest of the WAIS-R VOCAB > Q1 denotes highest (i.e., best) quartile; VOCAB <= Q1 denotes remaining lower 3 quartiles

