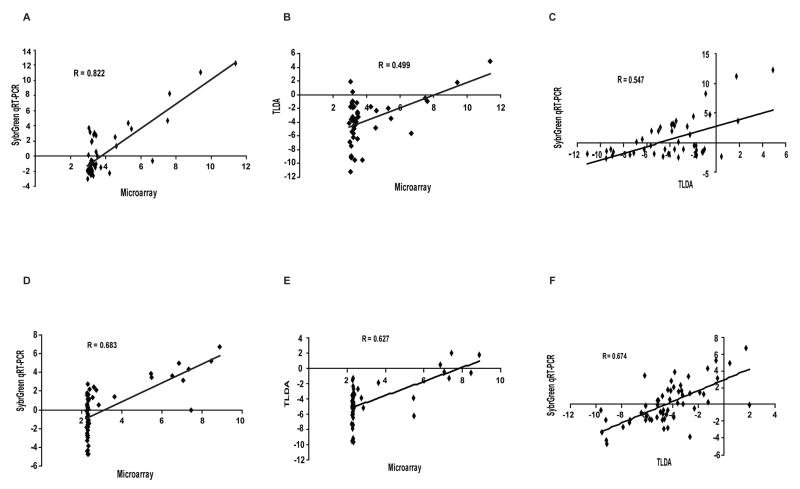
Figure 1. Correlation of gene expression data from three distinct platforms.
Expression profiles for ABCB1 across all 60 cell lines were compared between: (A) SYBR Green and microarray; (B) TLDA and microarray; (C) TLDA and SYBR Green. Identical comparisons were performed for ABCG2 expression profiles as described in the Supplement: (D) SYBR Green and microarray; (E) TLDA and microarray; (F) TLDA and SYBR Green. The data show that TLDA provides more sensitivity, yielding a larger dynamic range of measurement. The coefficient of correlation is given for each comparison.

