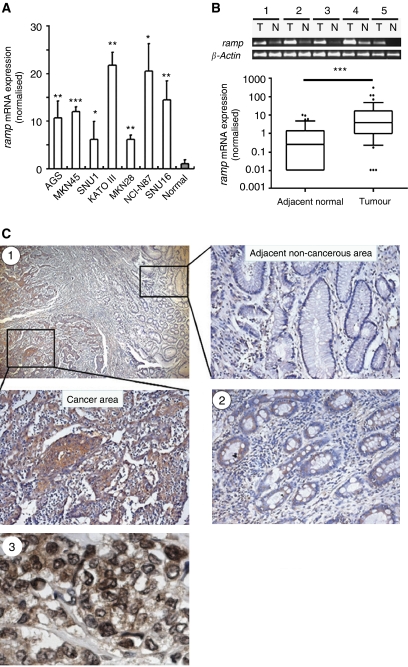
Figure 1.
mRNA expression levels of ramp in (A) human gastric cancer cell lines and (B) primary gastric cancer and their adjacent non-cancerous tissues were determined by quantitative real-time PCR. The results were expressed as the ratio of copies of ramp relevant to β-actin from at least three independent experiments. Data are expressed as mean±s.d.; *P<0.05, **P<0.01, ***P<0.0001. (C) Representative immunohistochemical staining of RAMP protein expression in gastric cancer (C1) and intestinal metaplasia (C2). (C3) Subcellular localisation of RAMP protein in human cancer cells. Black arrowheads indicate some examples of cancer cells with RAMP expression.

