
Figure 4.
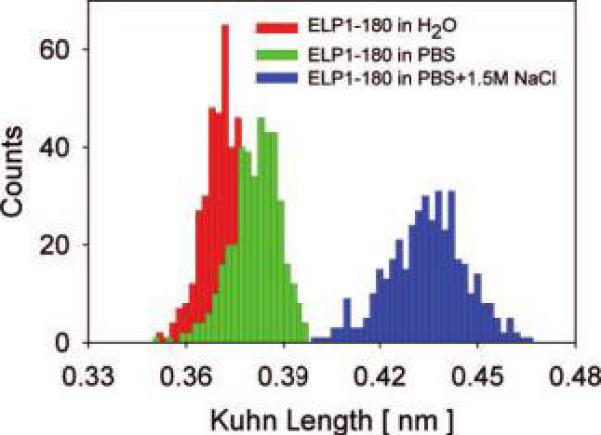
Distributions of the effective Kuhn segment lengths for ELP1—180 at different ionic strengths. Left histogram: l̄K= 0.37 ±0.01 nm in MQ-grade water. Center histogram: l̄K = 0.38 ± 0.02 nm in PBS solution. Right histogram: l̄K = 0.43 ± 0.02 nm in PBS with 1.5 M NaCl added.