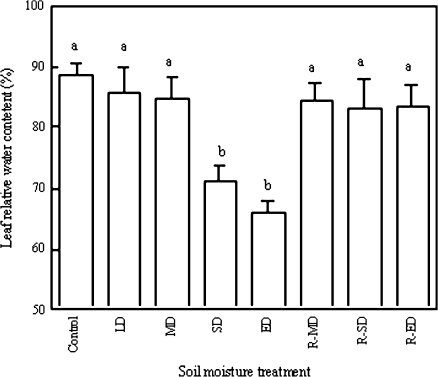
Fig. 1.
Leaf relative water content (RWC) under soil drought and rewatering (measured on 19 October 2005). Five SRWCs are indicated by control (75–80%), LD (6–75%), MD (50–60%), SD (35–50%), and ED (25–35%); R-MD, R-SD, and R-ED represent rewatering after the corresponding drought. All values are means ±SE for n=3–4. Bars with different lowercase letters are significantly different (P <0.05).

