Fig. 4.
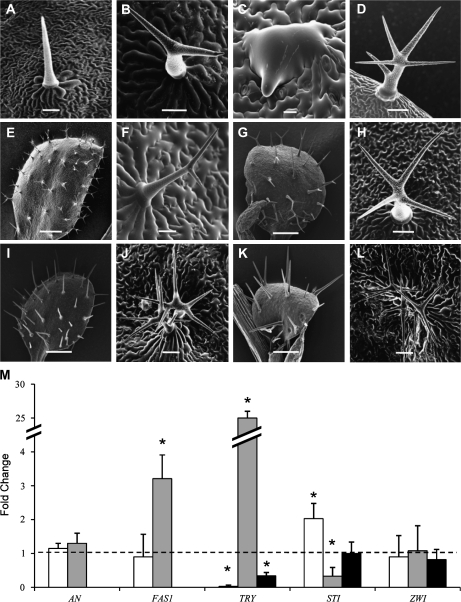
Epistatic analysis places ETR2 in the TRY and CAF1 controlled pathway. Representative cryo-SEM images of (A) etr2-3 (scale bar=100 μm), (B) gl3 (scale bar=100 μm) (C) etr2-3 gl3 (scale bar=10 μm), (D) spy-5 (scale bar=100 μm), (E) etr2-3 spy-5 (scale bar=1 mm), (F) gl2 (scale bar=100 μm), (G) etr2-3 gl2 (scale bar=1 mm), (H) fas1 (scale bar=100 μm), (I) etr2-3 fas1 (scale bar=100 μm). (J) try (scale bar=100 μm), (K) try etr2-3 (scale bar=100 μm), (L) try fas1-1 (scale bar=100 μm), (M) quantitative PCR analysis of ANGUSTIFOLIA, TRYPTICHON, and STICHEL expression in etr2-1 (white bars), etr2-3 (light grey bars), and fas1-1 (black bars) (n=3–5) as compared to wild-type levels (dashed line). asterisk indicates significant differences from Col-0 (for etr2-1 and etr2-3) and Enk-2 (for fas1-1) (P <0.05).

