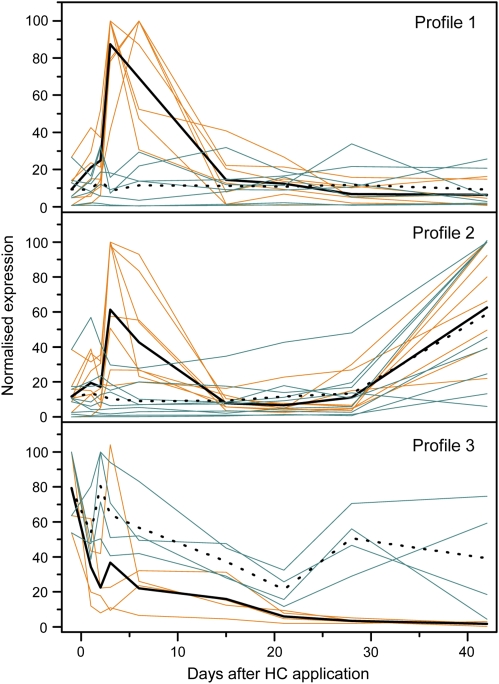
Fig. 3.
Grouping of normalized qPCR expression profiles of those genes selected from the microarray analysis (highest measured expression=100%). Profile 1: genes that were up-regulated in response to hydrogen cyanamide (HC) application, Profile 2: genes that were up-regulated in response to HC application and growth, and Profile 3: genes that were down-regulated in response to HC application and growth. The gold lines are with HC treatment, the blue lines are non-treated, the solid black lines are the mean values for HC treatment and the dotted black lines are the mean values for the non-treated. Expression is relative to that of Actinidia actin (AdActin).

