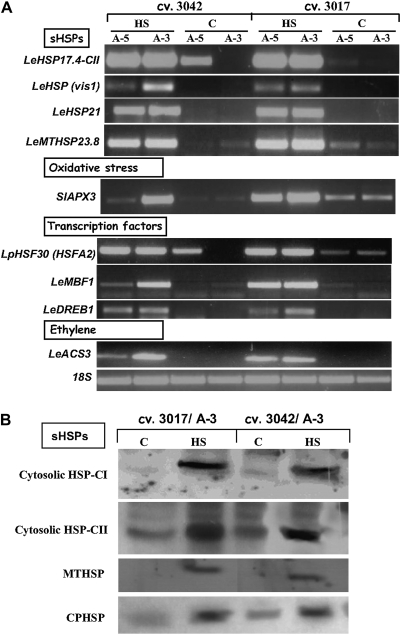
Fig. 3.
Validation of the microarray analysis results by semi-quantitative RT-PCR (A) and immunoblot (B) analyses. Expression levels were tested using either RNA (A) or protein (B), extracted from maturing microspores (5 d and/or 3 d before anthesis; A-5 and/or A-3, respectively) of at least 100 flowers, derived from plants of cv. Hazera 3017 and cv. Hazera 3042, which had been either kept under control conditions or exposed to HS (2 h at 43–45 °C). (A) Expression values were determined by semi-quantitative RT-PCR using gene-specific primers and at least three biological replicates. Several dilutions of template cDNA were tested in order to ensure that gene amplification was in the linear range, and expression levels are compared with expression of the 18S gene (accession X51576). (B) Expression was determined by immunoblot analysis, using 2 μg of total protein, extracted from maturing microspores at A-3, as detailed above. The blot was probed with polyclonal antibodies raised against class I and class II Arabidopsis 17.6 sHSPs (cytosolic HSP-CI and cytosolic HSP-CII, respectively; a gift from Professor E Vierling, University of Arizona, Tucson, AZ, USA), Chenopodium mitochondrial sHSP (MTHSP; a gift from Professor A Gau, University of Hannover, Hannover, Germany), and spinach chloroplast sHSP (CPHSP; a gift from Professor A Perl, The Volcani Center, ARO, Israel). The presented blot represents the results of three biological replicates. Gene names are abbreviated according to the nomenclature used by the NCBI, and the corresponding accession or AGI numbers as well as the Affy ID numbers appear in Table 1.

