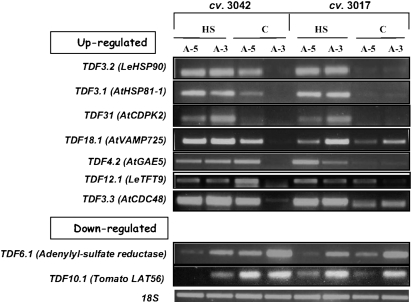
Fig. 5.
RT-PCR analysis of the steady-state transcript levels of selected TDFs. Expression levels were tested using RNA extracted from maturing microspores (5 and 3 d before anthesis; A-5 and A-3, respectively) of at least 100 flowers, derived from plants of cv. 3017 and cv. 3042, which had been either kept under control conditions (C) or exposed to HS (2 h at 43–45 °C). Expression values were determined by semi-quantitative RT-PCR using TDF-specific primers and at least three biological replicates. Several dilutions of template cDNA were tested in order to ensure that gene amplification was in the linear range, and expression levels are compared with the expression of the 18S gene (accession X51576).

