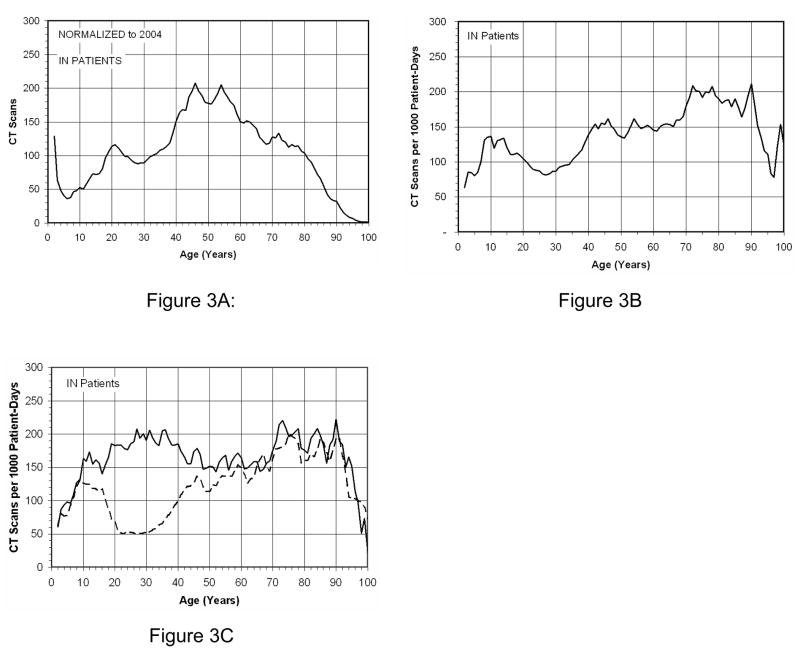
Figure 3.
The in-patient CT statistics are shown in this figure. Figure 3A illustrates the age distribution of CT scans performed in the calendar year 2004. Figure 3B illustrates the number of CT scans per 1,000 patient days as a function of age. The number of CT scans per 1,000 patient days is illustrated in Figure 3C for inpatients, broken down by sex.

