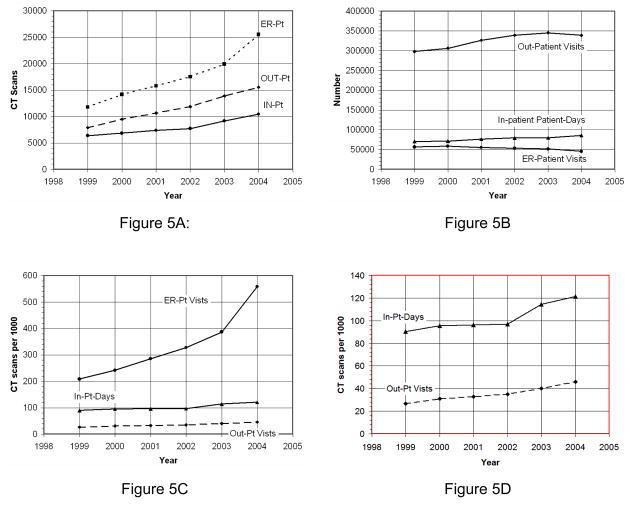
Figure 5.
Figure 5A: The raw (unnormalized) CT scan use is shown as a function of year. Figure 5B: The number of out-patient and ER-patient visits are illustrated, along with the number of In-patient patient-days. Figure 5C: The CT utilization rates are illustrated for out-patients, in-patients, and ER-patients. Figure 5D: an expansion of the in-patient and out-patient data shown in Figure 5C. The metric for out-patients and ER-patients is CT scans per 1000 visits, whereas the metric for in-patients is CT scans per 1000 Patient-Days.

