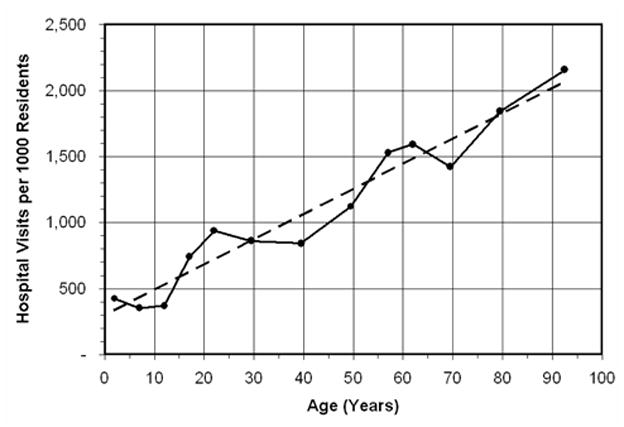
Figure 6.

The number of hospital visits (including in-, out-, and ER patients) as a function of age, per 1000 residents (of the same age group) in the 4 county catchment area of the medical center (population 1.93 million) is illustrated. The linear fit (dashed line) corresponds to Y = 297.66 + 19.173 X (r2 = 0.940).
