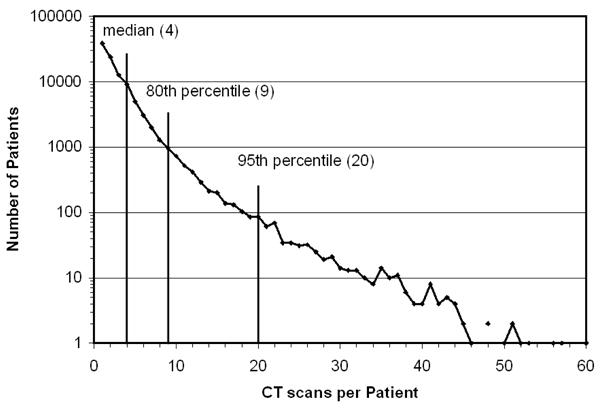
Figure 7.

A histogram showing the frequency distribution of the number of CT scans per patient undergoing CT is shown. The average CT patient received 2.88 CT studies. The ordinate axis is logarithmic, which is necessary to show the large range of data. Fifty percent of patients received 4 CT scans or less, while 80% of patients had 9 scans or less. Five percent of patients had more than 20 CT studies.
