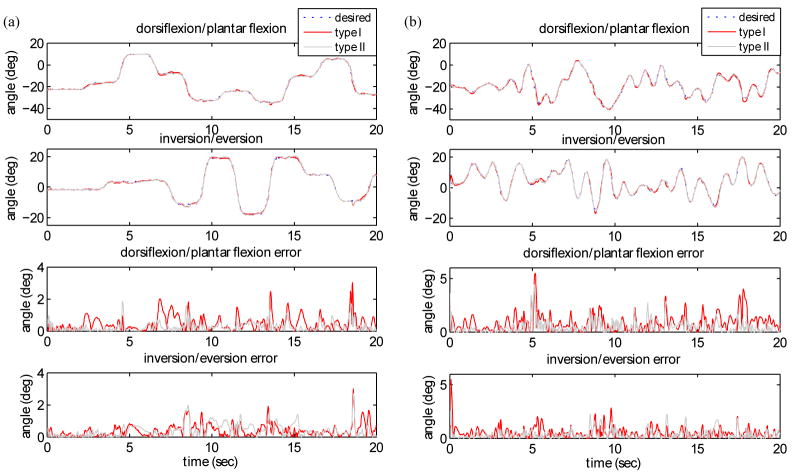
Fig. 6.
Results of type I and type II control with the total activation level 0.25 for (a) pseudo-step reference trajectories and (b) pseudo-random trajectories. E1 and E2 stand for ankle and subtalar joint RMS errors in degrees respectively. (a) Type I E1: 0.7°(1.4%) E2: 0.6° (1.5%), type II E1: 0.4° (0.8%) E2: 0.6° (1.5%) (b) type I E1: 1.2° (2.4%) E2: 0.8° (2.0%), type II E1: 0.8° (1.6%) E2: 0.6° (1.5%).

