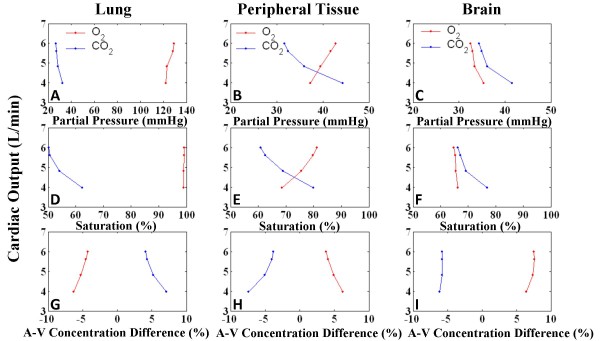
Figure 15.
Gas Exchange. Gas exchange indices for lung, peripheral tissue and brain for graded levels of effusion. Panels A-C show cardiac output (CO) vs. partial pressures, Panels D-F show CO vs. percent saturation, and Panels G-I show CO vs. arterio-venous (A-V) percent concentration difference for O2 and CO2. With decreasing CO, peripheral tissue shows hypercapnia and decrease in oxygenation with lowering PCO2, percent saturation and increased CO2 A-V difference; opposite trends are present for O2. Lung displays similar characteristics to a lesser extent. The cerebral tissue shows signs of hypercapnia but autoregulation of cerebral blood flow limits hypercapnia and increases oxygenation, shown by minimal CO2 A-V difference, PO2 and SO2.

