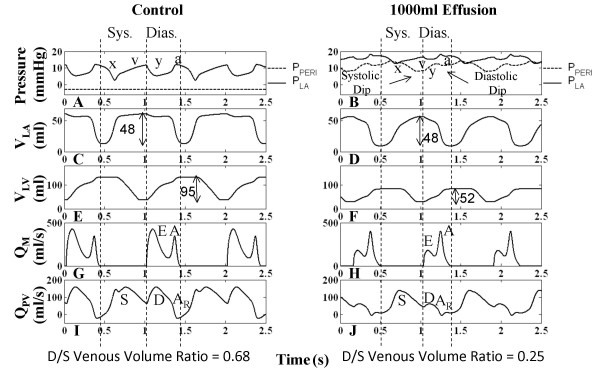
Figure 5.
Left Heart Hemodynamics. Left heart hemodynamic waveforms for the control and 1000-ml effusion cases during apnea at mean pleural pressure (-3 mmHg). The systolic and diastolic intervals are indicated, with relatively shorter intervals in the 1000-ml effusion case due to higher heart rate. The left column shows normal pericardial pressure and left atrial pressure (Panel A), left atrial volume (Panel C), left ventricular volume (Panel E), mitral flow (Panel G), and distal pulmonary venous flow (Panel I), respectively. With 1000-ml effusion (right column), the left atrial pressure waveform is elevated (Panel B) with diminished atrial relaxation (x-descent) and diastolic ventricular filling (y-descent) (Panel B). Pericardial pressure displays two dips in pressure, corresponding to ventricular ejection (labeled systolic dip) and atrial ejection (labeled diastolic dip). Systolic atrial filling is slowed as shown by the gradual increase in left atrial volume (Panel D). Ventricular volume variation is reduced as a result of both reduced LV filing and ejection, as shown by the volume labels in Panels E-F. The E-wave is reduced and the A-wave is more prominent (Panel H). The diastolic (D) and reversed (AR) components of venous flow are diminished (Panel I). The diastolic-to-systolic (D/S) venous volume ratio is shown below each case, which decreases with tamponade. See text for details.

