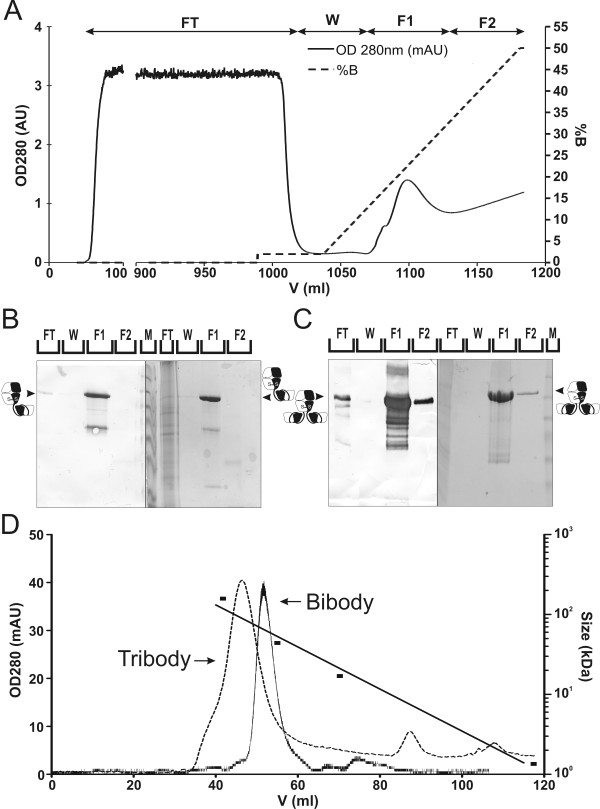
Figure 3.
Purification of NS0 produced PH1 bi- and tribody through IMAC and SEC. A, UV 280 nm (solid line) chromatogram of the serum free NS0 produced PH1 tribody, purified on a 20 ml C16/20 Chelating Sepharose Fast Flow column in 20 mM Phosphate buffer and eluted through an imidazole gradient (dotted line). B, C, 10% SDS-PAGE analysis of PH1 bibody (B) or tribody (C) IMAC fractions from NS0 culture supernatant. The left parts of the gel figures show anti-His MoAb developed blots with 1/1000 of a fraction loaded/lane. On the right, Coomassie stained gels are shown with 1/500 of a fraction/lane loaded. FT: flow through, W: Wash, F1, 2: elution fractions containing a mean of 200 and 400 mM imidazole respectively, M: relative molecular mass marker. The majority of the PH1 products are present in the 200 mM imidazole elution fraction. D, SEC purification of bi- and tribody IMAC elution fractions. UV 280 nm chromatogram of the NS0 produced PH1 bibody (solid line) and tribody (dotted line) purified on a C16/60 Sephacryl S-200 column. Arrows depict PH1 bibody and tribody peaks. Also indicated is the Bio-rad molecular mass standard run under similar conditions on the same column (black squares).

