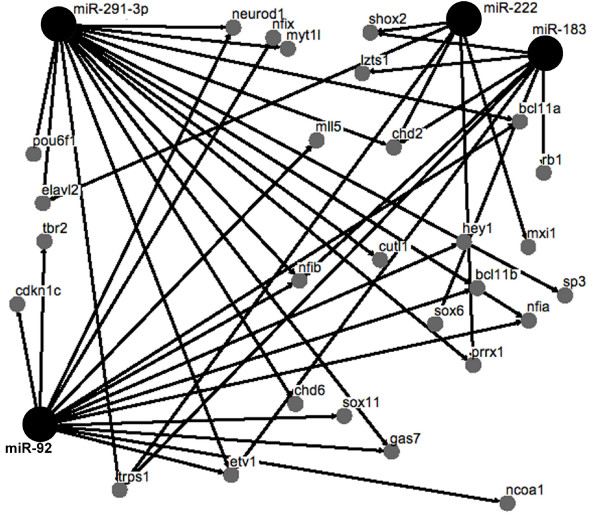
Figure 8.
Network analysis identifies miRNAs that are predicted to target multiple transcription factors. The small grey circles identify TFs that were up-regulated in neuronal progenitors between E11 and E13. Larger black circles identify miRNAs that were down-regulated in neuronal progenitors between E11 and E13. The connection lines indicate that a miRNA binding site was identified in the 3' UTR of the transcription factor using TargetScan for miRNA target prediction.

