
Figure 1.
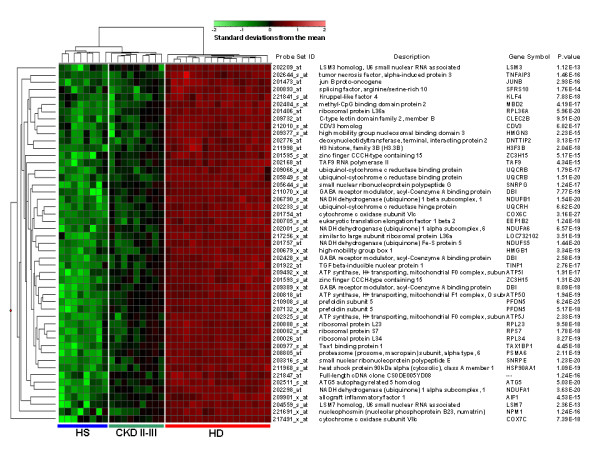
"Supervised" hierarchical clustering discriminating healthy subjects (HS), chronic kidney disease (CKD) and hemodialysis (HD) patients. (A) Patients are depicted as vertical columns, with blue line in the bottom indicating healthy subjects (HS) (n = 8), green indicating (CKD II–III) (n = 9) and red indicating (HD) (n = 17) patients. Forty-nine gene probe sets (rows, with gene names shown) were used for hierarchical clustering. P-values were calculated by ANOVA. The relative level of gene expression is depicted from lowest (green) to highest (red) according to the scale shown at the top.