Figure 5.
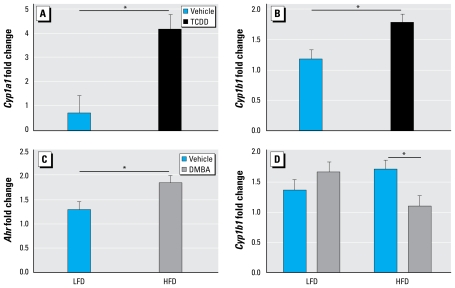
Maternal TCDD exposure and effect of diet on gene expression. Normalized message levels are represented as mean ± SE. (A) Induction of Cyp1a1 was increased by TCDD exposure compared with vehicle (n = 11 and 10 litters, respectively). Measurements were pooled across diet and DMBA groups. (B ) Induction of Cyp1b1 was increased by TCDD compared with vehicle (n = 11 and 10 litters, respectively). Measurements were pooled across diet and DMBA groups. (C) Induction of Ahr was increased by HFD relative to LFD (n = 11 and 10 litters, respectively). Measurements were pooled across TCDD and DMBA groups. (D) Induction of Cyp1b1 by DMBA was decreased compared with vehicle in HFD-fed but not in LFD-fed D2 mice. LFD groups are vehicle (n = 5 litters) and DMBA (n = 5 litters); HFD groups are vehicle (n = 6 litters) and DMBA (n = 5 litters).
*p < 0.05.

