Abstract
Increases in the power stroke and dwell durations of single molecules of E. coli F1-ATPase were measured in response to viscous loads applied to the motor and inhibition of ATP hydrolysis. The load was varied using different sizes of gold nanorods attached to the rotating γ subunit and/or by increasing the viscosity of the medium using PEG-400, a noncompetitive inhibitor of ATPase activity. Conditions that increase the duration of the power stroke were found to cause 20-fold increases in the length of the dwell. These results suggest that the order of hydrolysis, product release, and substrate binding may change as the result of external load on the motor or inhibition of hydrolysis.
Keywords: Power Stroke, F1-ATPase, Molecular Motors, Single Molecule Measurements
Mechanical work at the sub-cellular level is performed by enzymes called molecular motors that convert chemical energy in the form of either ATP or a transmembrane electrochemical gradient into mechanical energy by initiating conformational changes capable of performing work. Molecular motors are classified as either linear or rotary, depending upon the type of work they perform. The effect of external load on some linear molecular motors has been found to alter the relationship between the mechanical output and the kinetics of nucleotide binding, hydrolysis, and product release (1-8).
Application of a load to several motors perturbs the mechanical transitions in the catalytic cycle, causing a force-dependent shift in both the dwell time distribution and mechanical transitions (1). Several groups have observed changes in these distributions resulting from intra-molecular strain due to an applied external load that altered the conformations of the active site, and affected nucleotide binding, ATP hydrolysis, and product release (2, 5, 8-10). Single molecule studies using a laser trap revealed a 100-fold increase in the rate of ADP binding when 2 pN of load was applied to the linear molecular motor myosin VI (7). A biochemical mechanism was derived from this application of an external force that caused this motor to stop its transport function, and become a structural linker. Spudich (1) has suggested that the use of mechanical strain to alter protein function may serve as a widespread means of enzyme activity regulation.
The F1Fo ATP synthase is composed of the transmembrane Fo complex and extrinsic membrane F1 complex that couples the energy from a transmembrane proton gradient to synthesize ATP from ADP and phosphate. Both complexes are rotary molecular motors that use a common drive shaft composed of the γ and ε subunits. Crystal structures show that the F1 γ subunit is composed of two domains, a coiled-coil domain that protrudes through the center cavity of the (αβ)3 ring, and an open α-helix/β-sheet domain known as the foot that binds to the ε subunit and the c-subunit ring of Fo (11, 12). The F1-ATPase-driven and Fo-proton gradient-driven rotation of the γε subunits occur in opposite directions (11, 12).
The rotary cycle of the F1-ATPase molecular motor at saturating ATP concentrations involves three 120° power strokes each separated by a catalytic dwell (13). Catalytic dwell durations of 8 ms and 2 ms measured in F1 from E. coli and the thermophilic bacterium PS3, respectively, are consistent with the turnover time of ATP hydrolysis (14, 15). Early measurements with low temporal resolution were unable to resolve the velocity of the power stroke, but estimated torque to be about 40 pN nm (14). However, more recent measurements using acquisition rates of 100 kHz have shown that the velocity of the power stroke is 0.45 degrees μs-1, which results in a torque of 63 pN nm (15, 16). Torque values of 56 pN nm to 74 pN nm have also been estimated using other methods that do not rely on resolving the power stroke directly (17-20).
Rotation occurs in discrete 120° steps between the catalytic dwells under saturating ATP concentrations (21), where the rate limiting step is product release (22, 23). At rate-limiting concentrations of ATP, the 120° rotational steps occur in 80° and 40° substeps (24) that result in two different dwells. The duration of the dwell prior to the 80° substep is inversely proportional to the substrate concentration indicating that further rotation requires ATP binding. This dwell occurs at the 0° position and is often referred to as the ATP-waiting dwell. The dwell prior to the 40° rotational step does not change with ATP concentration and is likely the same dwell observed at saturating ATP. However, for the mutant βD190E where the rate limiting step is hydrolysis (25), the enzyme follows an alternative reaction pathway. In this pathway a 120° power stroke occurs after a dwell at the 0° position without stopping at the 80° position (26). A dwell at the 0° position also results from an application of external load to the motor that has been shown to alter the rate constant of ATP binding (9).
We now present measurements of the power stroke and dwell duration of single molecules of E. coli F1-ATPase in response to viscous loads applied to the motor. We show that an increase in the duration of the power stroke is correlated with a 20-fold increase in the length of the dwell. The results presented here show that the dwell duration is extended by application of an external load on the motor and/or by inhibition of ATP hydrolysis. These results suggest that the order of hydrolysis, product release, and substrate binding may change as the result of external load on the motor and inhibition of hydrolysis.
Experimental Procedures
The F1-ATPase was purified from E. coli XL-10 strain. F1 contains a His6 tag on the N-terminus of the α-subunit and γS193C for biotinylation as described previously (27, 28). Membranes were resuspended in Buffer A containing 5.0 mM TES, pH 7, 40 mM ε-amino-caproic acid, 1 mM EDTA, 1 mM DTT, 5.0% (v/v) glycerol, and the mixture was centrifuged at 180,000 × g for 1 hr at 4°C. The supernatant was mixed with Buffer B (0.5 M TRIS/pH 8.0, 1 M KCl, 300 mM imidazole, 50 mM MgCl2) at a 10:1 (v/v) ratio. Glycerol was added to 15% (v/v), and this mixture was loaded on a Ni-NTA column (0.8 cm in diameter, 1.5 cm3 of resin) washed initially with water and equilibrated with Buffer C (50 mM TRIS/pH 8.0, 100 mM KCl, 30 mM imidazole, 5 mM MgCl2, 15 % glycerol) to bind the F1-ATPase to the column, and the column was washed with 20 ml of Buffer C. To elute F1-ATPase, the column was then flushed with 3 ml of Buffer C containing 180 mM imidazole instead of 30 mM. To biotinylate the enzyme, 200 μl of F1 solution was mixed with an equimolar amount of biotin-maleimide (Pierce), and passed through a desalting column (Pierce) equilibrated with Buffer C. Biotinylated F1 was stored at 0.1 mg/ml at -80°C prior to use.
Where PEG-400 was present, the desired volume of PEG-400 was mixed with Buffer D (50 mM Tris-Cl/pH 8.0, 10 mM KCl), 60 μM phenol red pH indicator, and the desired amount of MgCl2 and ATP. A 1:2 mole ratio of Mg2+-ATP ratio was maintained to minimize the presence of free Mg2+. Since high concentrations of PEG-400 interfere with the accuracy of measurements by a pH meter, the pH was adjusted by comparing absorbance of the phenol red at 557 nm in the presence and absence of PEG-400. The viscosity of the solutions was measured with a Brookfield LVDV viscometer with UL adaptor at 28°C, and varied between 1-20 cP (16). The F1-ATPase activity was measured as described by (29) in 5 mM TRIS pH 8 and 55 mM KCl with the indicated amount of Mg2+-ATP in a Cary 100 spectrophotometer at 28° C.
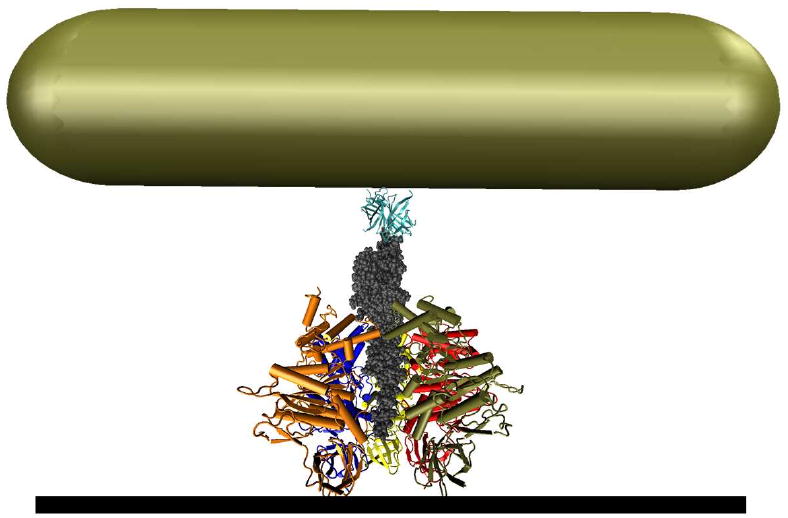
The power stroke of the enzyme was characterized by measuring the transition time, defined as the time required for the γ subunit to travel any 90° of the 120°. Single molecule rotation assays were performed as described by Spetzler et al. (15) with the following modifications. The F1-ATPase was bound to the surface of non-functionalized glass cover slips since there was no measurable difference in dwell or transitions times from enzyme bound to Ni-NTA coated cover slips. On average 25% were observed to rotate (27). Gold nanorods were made as previously described (15) except for the 91 × 45 nm rods, which were purchased from Nanopartz Inc. Single gold nanorods were initially identified to undergo F1-ATPase-dependent rotation by observing oscillations in light intensity through a polarizing filter via a Zeiss HSC color CCD camera at 55 fps. Each molecule was aligned confocal to a Perkin-Elmer SPCM-AQR-15 single photon detector to quantitate changes in scattered light intensity from the nanorods as a function of time. A total of 100 sec of data was collected in successive 5 sec data sets at each acquisition speed from 10- 200 kHz in 10 kHz increments for each molecule. Temperatures of the slide on the microscope while making the measurements were observed to vary between 27-29° C. The viscosity of the buffer used in these single molecule measurements was varied by increasing the concentration of polyethylene glycol 400 (PEG 400) in the rotation assay buffer (16).
The average dwell time was calculated by determining the number of hydrolysis events that occurred in a given time frame. This was measured by counting the number of times that the scattered light intensity spanned the 5th and 95th percentile of the dynamic range of the intensity of that data set. The average dwell time was calculated by dividing the total time by the number of 5th-95th percentile events.
The direction of rotation was determined by splitting the signal from a single gold nanorod and passing it through two polarizing filters that were offset from one another. The signals follow the relations I1 = A cos(Bx1 + C) and I2 = A cos(Bx2). This provides enough information to determine the direction that the gold nanorod has traveled between consecutive data points. The direction and magnitude of the movement was used to generated Figure 1 A and B.
Fig. 1.
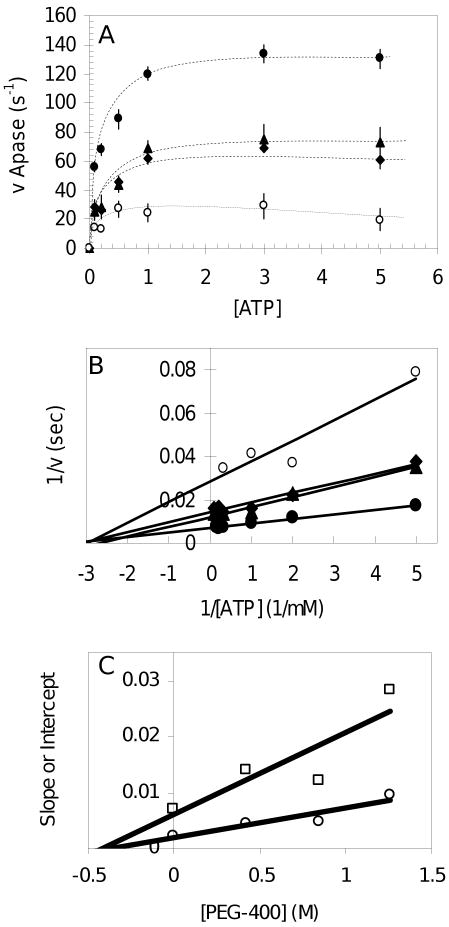
Noncompetitive inhibition of F1-ATPase activity by PEG-400. (A) Effect of PEG-400 on the bulk ATPase activity of F1 without nanorods. The linear initial rate of F1 ATPase activity was determined in triplicate with phenol red as indicated in Methods using 10 μg of F1 in the presence of (●) 0% PEG-400, (▲) 15% PEG-400, (◆) 30% PEG-400, (○) 45% PEG-400 (v/v). (B) Double reciprocal plot of the data from (A). (C) Plot of the the slopes (□) and y-intercepts (○) of each trend line from Figure 1B versus PEG-400 concentration. The absolute value of the x-intercepts determined by linear regression are defined as the inhibition constants Kis (slopes) and Kii (intercepts).
Results
In an effort to understand the effects of viscous load on the enzyme, the velocity of the 120° power stroke was measured as a function of load. The load was varied by changing the size of the nanorod attached to the γ subunit and the viscosity of the medium. Increasing concentrations of polyethylene glycol-400 (PEG-400) were used to vary the viscosity. This fluid is Newtonian and increases the viscosity to 20 cP at 60% (vol/vol) (16). Since crystal structures of F1 do not differ significantly when derived from crystals grown in PEG (30), this reagent is unlikely to alter tertiary structure of the enzyme significantly. However, as shown in Figure 1, PEG-400 was observed to inhibit F1-ATPase activity in bulk measurements. The lines of the double reciprocal plot converge on the x-axis (Figure 1B), indicating that PEG-400 inhibition causes equivalent changes in kcat and kcat/KM, characteristic of pure non-competitive inhibition. Figure 1C shows a plot of the slopes and y-intercepts from each trend line from Figure 1B versus PEG-400 concentration. The x-intercepts determined from linear regression show that the inhibition constants Kis (slopes) and Kii (intercepts) are equivalent, indicating that PEG-400 is a pure noncompetitive inhibitor. Thus, the PEG-400 dependent decreases in ATPase activity are not due to a decrease in the rate of either substrate binding or product release, and must therefore be due to the influence of PEG-400 on the rate of ATP hydrolysis.
Since PEG-400 inhibits F1-ATPase activity the load on the enzyme was varied in a manner independent of PEG-400 concentration. This was accomplished by using gold nanorods of 75 × 35, 87 × 36, 90 × 46, and 91 × 45 nm sizes (Figure 2A-D). It is noteworthy that the 91 × 45 nm nanorods had a rectangular profile compared to the 90 × 46 nm nanorods that had rounded ends, and thus while these two preps had similar size, their respective shapes were substantially different.
Fig. 2.
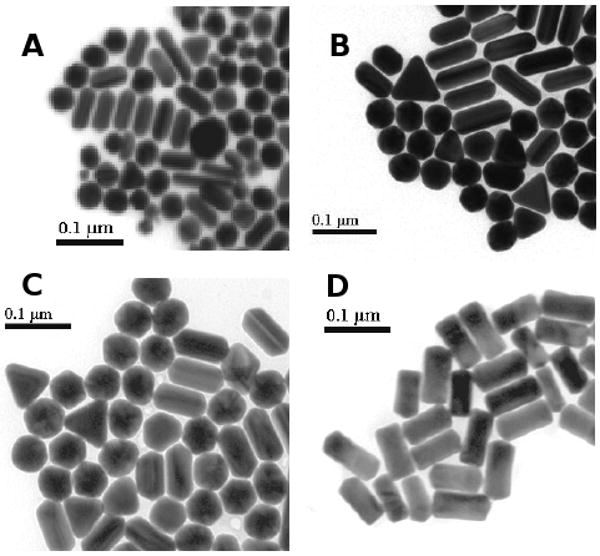
Electron micrographs of gold nanorods preparations used as probes to measure rotation. Triangles and spheres that appear in the preparations do not scatter both red and green light and are therefore excluded from rotation measurements. The average size of nanorods in each preparation was (A) 75 × 35 nm, (B) 87 × 36 nm, (C) 90 × 46 nm, and (D) 91 × 45 nm.
Rotation was observed as a change in the intensity of red light scattered from the nanorod (15), where the scattered light intensity is maximal and minimal when the long axis is parallel and perpendicular to the plane of polarization, respectively (31). Consequently, the intensity of light scattered from a nanorod changes in a sinusoidal manner as a function of the rotary position of the gold nanorod (15). To determine if the changes in scattered light intensity were the result of F1-driven unidirectional rotation, the light scattered from a single nanorod was split into two parts, each of which was directed through a separate polarizer to a photon counter. The difference in the planes of polarization caused a constant phase shift in the maxima between the photon counters that defines the direction of rotation (32).
The rotational position of a single gold nanorod attached to F1 in the presence of saturating ATP is shown in Figure 3A. Under these conditions, the F1-ATPase was observed to rotate almost exclusively counterclockwise in 120° steps (Figure 3A inset). Since this assay allows rotation data to be acquired for relatively long periods of time, it was possible to observe that the CCW rotation catalyzed by the enzyme was sustained. Figure 3B shows a typical individual power stroke in the absence of PEG-400. The intensity of scattered light follows a sinusoidal pattern in response to rotation of the nanorod. Thus, the greatest sensitivity with which to quantitate the power stroke velocity occurs during that 90° of rotation in which the intensity changes between minimum and maximum values. Consequently, velocities were calculated based on the time required for the nanorod to travel 90° that we designate as the transition time.
Fig. 3.
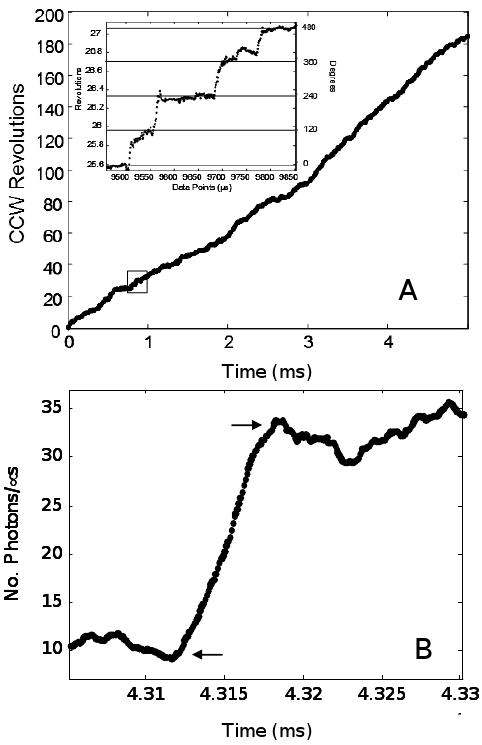
Single molecule rotation profile. (A) Time course of rotational position of a single F1 molecule determined from the offset between two polarizers with data acquired at 10 kHz. All single molecule measurements were performed with 1mM MgCl2 and 2mM ATP. (Inset) Detail of the rotational stepping of the boxed region. Horizontal lines show the 120° dwell positions. (B) Individual power stroke collected at 100 kHz using 91 × 45 nm nanorods in the presence of 0% PEG-400. Arrows indicate the beginning and end of the transition used to determine the rate of the power stroke.
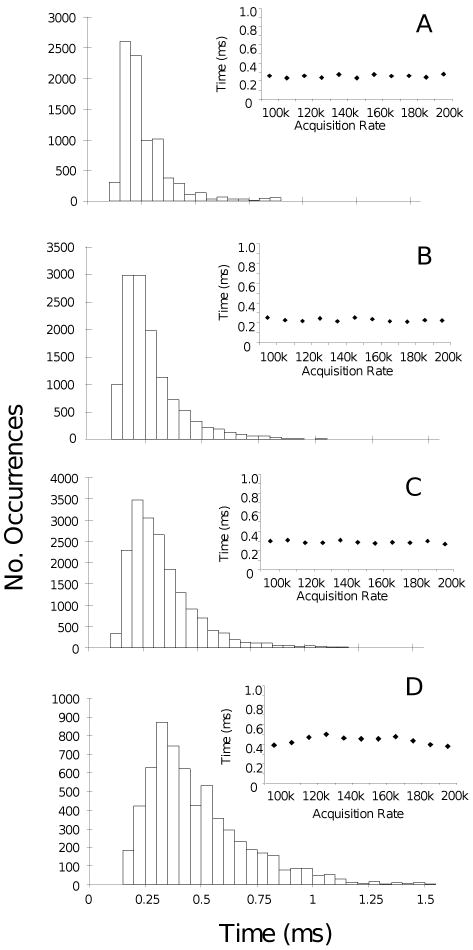
The transition times of several thousand power strokes were measured and averaged for each F1-ATPase molecule for each size of nanorod (Figure 4A-D). A data set to characterize a single condition was considered complete when it contained at least 20,000 power strokes from at least 15 different molecules. The rate of data acquisition was varied to ensure that the transition times measured were independent of the method used to collect data. Measurements of the transition times for single F1 molecules were acquired at rates ranging from 100 kHz to 200 kHz in increments of 10 kHz. The average transition time from each acquisition rate did not change significantly (Figure 4A-D, insets). Thus, the average of the distributions formed from measurements at all acquisition rates was used to describe the transition times for any given molecule.
Fig. 4.
Distributions of transition times from single molecules collected at 1mM MgCl2 and 2mM ATP at100 kHz using (A) 75 × 35 nm, (B) 87 × 36 nm, (C) 90 × 46 nm, and (D) 91 × 45 nm nanorods. (Insets) The average time of each distribution for each nanorod preparation, respectively, as a function of data acquisition rate.
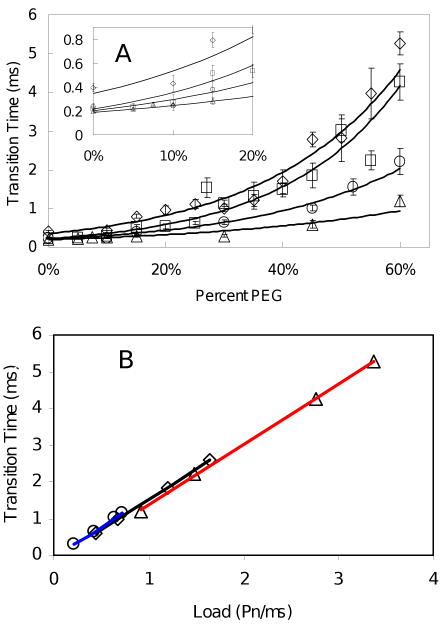
The mean power stroke duration for each nanorod size as a function of PEG-400 concentration is shown in Figure 5A. The duration of the transition for the three smallest nanorods converged to ∼250 μs at low viscosities (Figure 5A inset) indicating that the velocity of the power stroke was limited by intrinsic properties of the enzyme. The transition times of the 91 × 45 nm nanorods never reached ∼250 μs indicating that the power stroke velocity was always limited by the viscous load on the motor. The difference in performance between these nanorods and the 90 × 46 nm nanorods is likely due to the fact that the ends of the former nanorods are more rounded (Figure 2). This difference in shape results in a difference in a significantly larger drag for the 91 × 45 nm nanorods (33).
Fig. 5.
Transition times as a function of PEG-400 concentration and nanorod size at 1mM MgCl2 and 2mM ATP. (A) Average transition times as a function of PEG-400 concentration measured using 75 × 35 nm (▵), 87 × 36 nm (○), 90 × 46 nm (□) and 91 × 45 nm (◊) nanorods. (Inset) Expansion of data between 0% and 20% PEG-400 shows that the transition times for the three smallest nanorods converge to a single value of ∼250 μs. (B) Transition times plotted as a function of increasing nanorod size at fixed PEG-400 concentrations. Lines are the linear best fit for 30% (blue), 45% (black), and 60% (red) PEG-400.
The transition time for each nanorod size at various fixed PEG-400 concentrations was plotted as a function of the load (Figure 5B). Load was estimated using the relation Γ = T/ω, where T is the torque, 61 pN nm (16), and ω is the velocity determined from the transition time (the measured transition time, t, is reciprocal to ω and hence t is proportional to Γ/T). Linear best fit trend lines (r2 > 0.999) for the transition times at 30%, 45%, and 60% PEG-400 showed no significant differences in the slopes or intercepts. This indicates that increases in transition time resulted solely from an increase in the viscous load and not from decreases in ATPase activity resulting from PEG-400 inhibition. The transition times for 0%, 5%, and 15% PEG-400 were not included since they were limited by intrinsic properties of the enzyme and thus did not change. The linear plot in Fig. 5B implies that the torque produced during the power strokes is independent of the addition of PEG-400 and of using nanorods of different sizes, and is consistent with previous results that show the torque is constant at different PEG-400 concentrations (16).
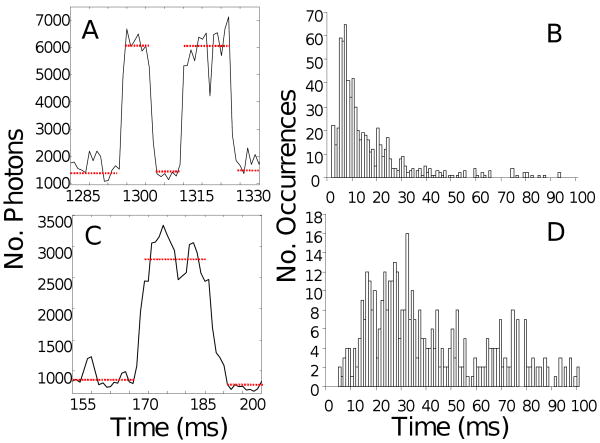
Figure 6A,C shows representative dwells at each PEG-400 concentration examined where the duration of each dwell is indicated by a red dotted line. Histograms of the average dwell time for each molecule for the 75 × 35 nm nanorods (Figure 6B,D) showed an increase in the duration of the dwell with increasing PEG-400 concentration. The median of the dwell time population was used to compare dwell times between different conditions to avoid the error in the mean caused by long dwells that resulted from entrapped Mg2+ADP. The results in the absence of PEG-400 are consistent with previous studies where the dwell time from single molecule experiments was compared to the inverse of kcat for the ATP hydrolysis rate measured in bulk solution (14, 15, 34).
Fig. 6.
Dwell times in the absence (A,B) and presence (C,D) of 60 % PEG-400 at 1mM MgCl2 and 2mM ATP. (A,C) Changes in the intensity of scattered light from a single 75 × 35 nm nanorod attached to an F1-ATPase molecule during rotation for 45 ms acquired at 100 kHz for 0% and 60% PEG-400, respectively. Each data point is 10μs, and dwells are indicated by dotted lines. (B,D) Histograms of average F1 dwell times acquired at 100-200 kHz using the same nanorods and PEG-400 concentrations as in (A,C), respectively.
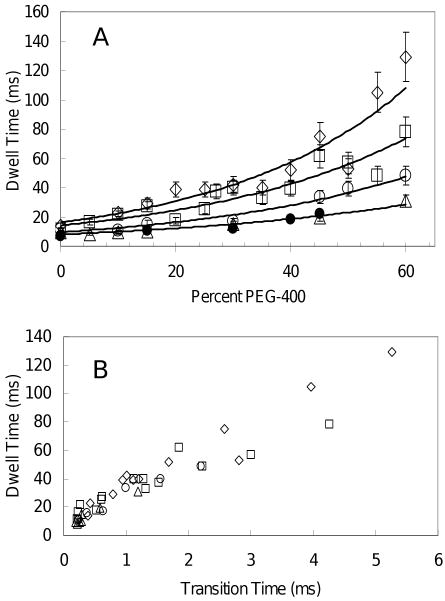
The dwell duration as a function of PEG-400 concentration for all sizes of nanorods is shown in Figure 7A. The solid circles show the inverse of the kcat from bulk ATPase experiments in the absence of nanorods, and are comparable to the dwell times observed with the smallest nanorods; i.e. the decrease in activity observed in the bulk experiments is equivalent to the decrease observed in the dwell time. Thus the inhibition of ATPase activity by PEG-400 dominates any contribution to the dwell duration from the load of the smallest nanorods. The three largest nanorods have dwell times that are significantly longer than the inverse of the kcat of the ATP hydrolysis rate. This indicates that the load significantly contributes to the dwell duration under these conditions. The heterogeneity of the nanorods was significantly smaller than the stochastic variation in the transition and dwell times, and thus did not significantly contribute to deviations in the measurements, as can be seen by the comparison of the bulk ATPase rates and the dwell times with the smallest rods (Figure 7A). A linear trend was observed between transition time and the dwell over the large range of viscous loads examined. A scatter plot of the dwell times versus the transition times revealed a strong linear correlation (correlation coefficient = 0.935) between these two variables (Figure 7B) with about a 20-fold increase in the dwell time in response to increases in the transition time.
Fig. 7.
(A) Average dwell times of F1 as a function of percent PEG-400 using 75 × 35 nm (▵), 87 × 36 nm (○), 90 × 46 nm (□) and 91 × 45 nm (◊) nanorods at 1mM MgCl2 and 2mM ATP. The inverse of the kcat from bulk ATPase measurements (●) from Figure 1. (B) Linear correlation between the transition time and dwell time (correlation coefficient = 0.935) for 75 × 35 nm (▵), 87 × 36 nm (○), 90 × 46 nm (□) and 91 × 45 nm (◊) nanorods.
Discussion
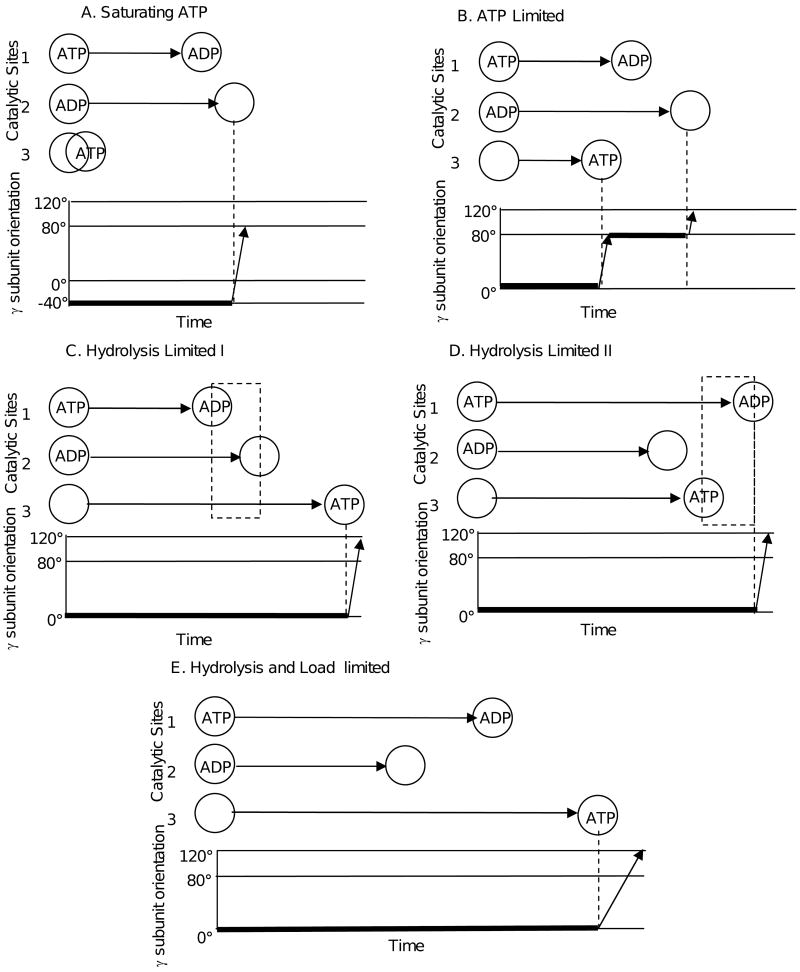
At saturating ATP concentrations in the absence of PEG-400, rotation occurred in CCW 120° steps (Figure 3) as has been observed elsewhere (15, 17, 23). Under these conditions, the enzyme follows the conventional reaction pathway that involves a catalytic dwell at the -40° (equivalent to 80°) position followed by a 120° power stroke initiated by product release (Figure 8A) (13, 15, 21). In this three site model (35), ATP hydrolysis and ATP binding occur prior to product release, which may be ADP (41, 42) or Pi (36), though only ADP is shown for simplicity in Figure 8. Thus the presence of product at site 2 is thought to prohibit rotation past the 80° position. At limiting ATP concentrations (Figure 8B), ATP binding occurs after product release resulting in a second dwell at the 0° position (ATP-waiting dwell) (14, 24). This dwell can also be induced by the application of an external load sufficient to slow the power stroke that in turn reduces the rate constant of ATP binding (9). Based on these observations, substrate binding at site 3 is thought to be required to initiate rotation past the 0° position (14).
Fig. 8.
(A) The conventional reaction pathway at saturating ATP concentrations. (B) The conventional reaction pathway at limiting ATP concentrations. (C) The alternate reaction pathway from Shimabukuro et al. (26). Dotted box shows when the enzyme has two ADP bound. (D) Modifications to the alternate reaction pathway compatible with the data presented here when only hydrolysis is limiting. Dotted box shows when the enzyme has two ATP bound. (E) Additional modifications to the alternate reaction pathway when both hydrolysis and ATP binding are limited compatible with the data presented here.
The results presented here show that application of an external load on the motor causes the dwell to lengthen (Figure 7A), consistent with a decrease in the rate constant of ATP binding as is observed in PS3 (9). The dwell duration also increases as a result of inhibition of ATP hydrolysis by PEG-400 (Figure 7A, solid dots). Similar increases in dwell duration have been observed with the βD190E mutant of the catalytic base in the thermophilic bacterium PS3 that slow the rate of hydrolysis (25, 26). The βD190E mutant follows an alternate reaction pathway where product release occurs before substrate binding that causes the γ-subunit to dwell in the 0° position after which it rotates by 120°, skipping the dwell at the 80° position (Figure 8C) (28). In this proposed alternate reaction pathway the order of events is hydrolysis at Site 1, followed by product release at Site 2, and then substrate binding at Site 3. This leads to a nucleotide occupancy state where two ADP are bound at one time (dotted box Figure 8C) similar to that observed in three F1 crystal structures (30, 37, 38).
We propose two additional reaction pathways that could occur when the rate of hydrolysis has been decreased and/or the load on the γ subunit decreases the rate constant for ATP binding. The first occurs when ATP binds to Site 3 prior to hydrolysis in Site 1, but after product release in Site 2 (Figure 8D). Under these conditions, the dwell duration is determined by the rate of hydrolysis at Site 2 and is not additionally extended by increases in the time required to bind ATP to Site 3 (Figure 7 solid dots and open triangles) caused by external load on the motor that slows the power stroke (Figure 5 open triangles). This model requires that rotation be inhibited when two ATP are bound and that hydrolysis at Site 1 initiates the power stroke at the 0° position. This leads to a nucleotide occupancy state where two ATP are bound at one time while the third site is empty (dotted box Figure 8D). It is noteworthy that two ATP or ATP analogues are bound to the enzyme simultaneously in six F1 crystal structures with one site empty (11, 46, 47).
In the second possible reaction pathway, ATP hydrolysis in Site 1 occurs before ATP binding in Site 3, but after product release in Site 2 (Figure 8E). Under these conditions, the external load on the motor increases the time required for ATP to bind (9) to a greater extent than the time required for hydrolysis to occur when inhibited by PEG-400. This is consistent with the results presented here, where the three largest sizes of nanorods significantly increase the duration of the power stroke (Figure 5 open circles, squares, and diamonds) and have longer dwell durations than when the enzyme is limited by hydrolysis (Figure 7, solid circles, open circles, squares, and diamonds).
The reaction pathways of Figure 8C, D, and E differ from the conventional pathway (Figure 8 A and B) with regard to the order of hydrolysis, product release, and substrate binding events. This change in order may account for the absence of the dwell at the 80° position in the alternate reaction pathways. The presence of product at Site 2 prohibits rotation past the 80° dwell position (24, 25). Thus, when product has been released from Site 2 before rotation has been triggered by either substrate binding at Site 3 (Figure 8C and E) or hydrolysis at Site 1 (Figure 8D), the 80° dwell position does not occur. Instead rotation continues past this point and ends after 120°. Consequently, when rotation is triggered at the 0° position and there is no product in Site 2, rotation occurs in a single 120° event. The results presented here suggest two new forms of the alternate reaction pathway (Figure 8D and E), but do not eliminate the reaction pathway of Figure 8C. Since crystal structures provide evidence that both situations occur, it appears that hydrolysis, product release, and substrate binding may occur in different orders, depending upon the conditions.
Acknowledgments
We would like to thank Dr. Michael Berg for insightful discussions and editorial review. This project was supported by award R01GM50202 to WDF from NIGMS. The content is solely the responsibility of the authors and does not necessarily represent the official views of the National Institute of General Medical Sciences or the National Institutes of Health.
References
- 1.Spudich JA. Molecular motors take tension in stride. Cell. 2006;126:242–244. doi: 10.1016/j.cell.2006.07.009. [DOI] [PubMed] [Google Scholar]
- 2.Veigel C, Schmitz S, Wang F, Sellers JR. Load-dependent kinetics of myosin-V can explain its high processivity. Nat Cell Biol. 2005;7:861–869. doi: 10.1038/ncb1287. [DOI] [PubMed] [Google Scholar]
- 3.Toba S, Watanabe TM, Yamaguchi-Okimoto L, Toyoshima YY, Higuchi H. Overlapping hand-over-hand mechanism of single molecular motility of cytoplasmic dynein. Proc Natl Acad Sci U S A. 2006;103:5741–5745. doi: 10.1073/pnas.0508511103. [DOI] [PMC free article] [PubMed] [Google Scholar]
- 4.Reck-Peterson SL, Yildiz A, Carter AP, Gennerich A, Zhang N, Vale RD. Single-molecule analysis of dynein processivity and stepping behavior. Cell. 2006;126:335–348. doi: 10.1016/j.cell.2006.05.046. [DOI] [PMC free article] [PubMed] [Google Scholar]
- 5.Purcell TJ, Sweeney HL, Spudich JA. A force-dependent state controls the coordination of processive myosin V. Proc Natl Acad Sci U S A. 2005;102:13873–13878. doi: 10.1073/pnas.0506441102. [DOI] [PMC free article] [PubMed] [Google Scholar]
- 6.Mallik R, Carter BC, Lex SA, King SJ, Gross SP. Cytoplasmic dynein functions as a gear in response to load. Nature. 2004;427:649–652. doi: 10.1038/nature02293. [DOI] [PubMed] [Google Scholar]
- 7.Altman D, Sweeney HL, Spudich JA. The mechanism of myosin VI translocation and its load-induced anchoring. Cell. 2004;116:737–749. doi: 10.1016/s0092-8674(04)00211-9. [DOI] [PubMed] [Google Scholar]
- 8.Baker JE, Krementsova EB, Kennedy GG, Armstrong A, Trybus KM, Warshaw DM. Myosin V processivity: multiple kinetic pathways for head-to-head coordination. Proc Natl Acad Sci U S A. 2004;101:5542–5546. doi: 10.1073/pnas.0307247101. [DOI] [PMC free article] [PubMed] [Google Scholar]
- 9.Watanabe-Nakayama T, Toyabe S, Kudo S, Sugiyama S, Yoshida M, Muneyuki E. Effect of external torque on the ATP-driven rotation of F1-ATPase. Biochem Biophys Res Commun. 2008;366:951–957. doi: 10.1016/j.bbrc.2007.12.049. [DOI] [PubMed] [Google Scholar]
- 10.Guydosh NR, Block SM. Backsteps induced by nucleotide analogs suggest the front head of kinesin is gated by strain. Proc Natl Acad Sci U S A. 2006;103:8054–8059. doi: 10.1073/pnas.0600931103. [DOI] [PMC free article] [PubMed] [Google Scholar]
- 11.Sabbert D, Engelbrecht S, Junge W. Intersubunit rotation in active F-ATPase. Nature. 1996;381:623–625. doi: 10.1038/381623a0. [DOI] [PubMed] [Google Scholar]
- 12.Borsch M, Turina P, Eggeling C, Fries JR, Seidel CA, Labahn A, Graber P. Conformational changes of the H+-ATPase from Escherichia coli upon nucleotide binding detected by single molecule fluorescence. FEBS Lett. 1998;437:251–254. doi: 10.1016/s0014-5793(98)01247-2. [DOI] [PubMed] [Google Scholar]
- 13.Noji H, Yasuda R, Yoshida M, Kinosita K., Jr Direct observation of the rotation of F1-ATPase. Nature. 1997;386:299–302. doi: 10.1038/386299a0. [DOI] [PubMed] [Google Scholar]
- 14.Yasuda R, Noji H, Yoshida M, Kinosita K, Itoh H. Resolution of distinct rotational substeps by submillisecond kinetic analysis of F-1-ATPase. Nature. 2001;410:898–904. doi: 10.1038/35073513. [DOI] [PubMed] [Google Scholar]
- 15.Spetzler D, York J, Daniel D, Fromme R, Lowry D, Frasch W. Microsecond Time Scale Rotation Measurements of Single F(1)-ATPase Molecules. Biochemistry. 2006;45:3117–3124. doi: 10.1021/bi052363n. [DOI] [PMC free article] [PubMed] [Google Scholar]
- 16.Hornung T, Ishmukhametov R, Spetzler D, Martin J, Frasch WD. Determination of torque generation from the power stroke of Escherichia coli F1-ATPase. Biochim Biophys Acta. 2008;1777:579–582. doi: 10.1016/j.bbabio.2008.04.016. [DOI] [PMC free article] [PubMed] [Google Scholar]
- 17.Pilizota T, Bilyard T, Bai F, Futai M, Hosokawa H, Berry RM. A programmable optical angle clamp for rotary molecular motors. Biophysical Journal. 2007;93:264–275. doi: 10.1529/biophysj.106.091074. [DOI] [PMC free article] [PubMed] [Google Scholar]
- 18.Cherepanov DA, Junge W. Viscoelastic dynamics of actin filaments coupled to rotary F-ATPase: curvature as an indicator of the torque. Biophys J. 2001;81:1234–1244. doi: 10.1016/S0006-3495(01)75781-5. [DOI] [PMC free article] [PubMed] [Google Scholar]
- 19.Panke O, Cherepanov DA, Gumbiowski K, Engelbrecht S, Junge W. Viscoelastic dynamics of actin filaments coupled to rotary F-ATPase: angular torque profile of the enzyme. Biophys J. 2001;81:1220–1233. doi: 10.1016/S0006-3495(01)75780-3. [DOI] [PMC free article] [PubMed] [Google Scholar]
- 20.Panke O, Cherepanov DA, Gumbiowski K, Engelbrecht S, Junge W. Viscoelastic dynamics of actin filaments coupled to rotary F-ATPase: Angular torque profile of the enzyme (vol 81, pg 1220, 2001) Biophysical Journal. 2002;83:582–582. doi: 10.1016/S0006-3495(01)75780-3. [DOI] [PMC free article] [PubMed] [Google Scholar]
- 21.Yasuda R, Noji H, Kinosita K, Jr, Yoshida M. F1-ATPase is a highly efficient molecular motor that rotates with discrete 120 degree steps. Cell. 1998;93:1117–1124. doi: 10.1016/s0092-8674(00)81456-7. [DOI] [PubMed] [Google Scholar]
- 22.Sielaff H, Rennekamp H, Engelbrecht S, Junge W. Functional halt positions of rotary FOF1-ATPase correlated with crystal structures. Biophys J. 2008;95:4979–4987. doi: 10.1529/biophysj.108.139782. [DOI] [PMC free article] [PubMed] [Google Scholar]
- 23.Grubmeyer C, Cross RL, Penefsky HS. Mechanism of ATP hydrolysis by beef heart mitochondrial ATPase. Rate constants for elementary steps in catalysis at a single site. J Biol Chem. 1982;257:12092–12100. [PubMed] [Google Scholar]
- 24.Sakaki N, Shimo-Kon R, Adachi K, Itoh H, Furuike S, Muneyuki E, Yoshida M, Kinosita K. One rotary mechanism for F1-ATPase over ATP concentrations from millimolar down to nanomolar. Biophysical Journal. 2005;88:2047–2056. doi: 10.1529/biophysj.104.054668. [DOI] [PMC free article] [PubMed] [Google Scholar]
- 25.Shimabukuro K, Yasuda R, Muneyuki E, Hara KY, Kinosita K, Jr, Yoshida M. Catalysis and rotation of F1 motor: cleavage of ATP at the catalytic site occurs in 1 ms before 40 degree substep rotation. Proc Natl Acad Sci U S A. 2003;100:14731–14736. doi: 10.1073/pnas.2434983100. [DOI] [PMC free article] [PubMed] [Google Scholar]
- 26.Shimabukuro K, Muneyuki E, Yoshida M. An alternative reaction pathway of F1-ATPase suggested by rotation without 80 degrees/40 degrees substeps of a sluggish mutant at low ATP. Biophys J. 2006;90:1028–1032. doi: 10.1529/biophysj.105.067298. [DOI] [PMC free article] [PubMed] [Google Scholar]
- 27.York J, Spetzler D, Hornung T, Ishmukhametov R, Martin J, Frasch WD. Abundance of Escherichia coli F1-ATPase molecules observed to rotate via single-molecule microscopy with gold nanorod probes. J Bioenerg Biomembr. 2007;39:435–439. doi: 10.1007/s10863-007-9114-x. [DOI] [PubMed] [Google Scholar]
- 28.Greene MD, Frasch WD. Interactions among gamma R268, gamma Q269, and the beta subunit catch loop of Escherichia coli F1-ATPase are important for catalytic activity. J Biol Chem. 2003;278:51594–51598. doi: 10.1074/jbc.M309948200. [DOI] [PubMed] [Google Scholar]
- 29.Ishmukhametov RR, Galkin MA, Vik SB. Ultrafast purification and reconstitution of His-tagged cysteine-less Escherichia coli F1Fo ATP synthase. Biochim Biophys Acta. 2005;1706:110–116. doi: 10.1016/j.bbabio.2004.09.012. [DOI] [PubMed] [Google Scholar]
- 30.Gibbons C, Montgomery MG, Leslie AG, Walker JE. The structure of the central stalk in bovine F(1)-ATPase at 2.4 A resolution. Nat Struct Biol. 2000;7:1055–1061. doi: 10.1038/80981. [DOI] [PubMed] [Google Scholar]
- 31.Sonnichsen C, Alivisatos AP. Gold nanorods as novel nonbleaching plasmon-based orientation sensors for polarized single-particle microscopy. Nano Lett. 2005;5:301–304. doi: 10.1021/nl048089k. [DOI] [PubMed] [Google Scholar]
- 32.Spetzler D, York J, Martin J, Ishmukhametov R, Frasch WD. Microsecond resolution of enzymatic conformational changes using dark-field microscopy. Methods. 2008 doi: 10.1016/j.ymeth.2008.05.004. [DOI] [PubMed] [Google Scholar]
- 33.Rudyak VY, Belkin AA, Tomilina EA. Force acting on a nanoparticle in a fluid. Technical Physics Letters. 2008;34:76–78. [Google Scholar]
- 34.Nakanishi-Matsui M, Kashiwagi S, Hosokawa H, Cipriano DJ, Dunn SD, Wada Y, Futai M. Stochastic high-speed rotation of Escherichia coli ATP synthase F1 sector: the epsilon subunit-sensitive rotation. J Biol Chem. 2006;281:4126–4131. doi: 10.1074/jbc.M510090200. [DOI] [PubMed] [Google Scholar]
- 35.Ariga T, Muneyuki E, Yoshida M. F1-ATPase rotates by an asymmetric, sequential mechanism using all three catalytic subunits. Nat Struct Mol Biol. 2007;14:841–846. doi: 10.1038/nsmb1296. [DOI] [PubMed] [Google Scholar]
- 36.Adachi K, Oiwa K, Nishizaka T, Furuike S, Noji H, Itoh H, Yoshida M, Kinosita K., Jr Coupling of rotation and catalysis in F(1)-ATPase revealed by single-molecule imaging and manipulation. Cell. 2007;130:309–321. doi: 10.1016/j.cell.2007.05.020. [DOI] [PubMed] [Google Scholar]
- 37.Kagawa R, Montgomery MG, Braig K, Leslie AG, Walker JE. The structure of bovine F1-ATPase inhibited by ADP and beryllium fluoride. EMBO J. 2004;23:2734–2744. doi: 10.1038/sj.emboj.7600293. [DOI] [PMC free article] [PubMed] [Google Scholar]
- 38.Gledhill JR, Montgomery MG, Leslie AG, Walker JE. How the regulatory protein, IF(1), inhibits F(1)-ATPase from bovine mitochondria. Proc Natl Acad Sci U S A. 2007;104:15671–15676. doi: 10.1073/pnas.0707326104. [DOI] [PMC free article] [PubMed] [Google Scholar]


