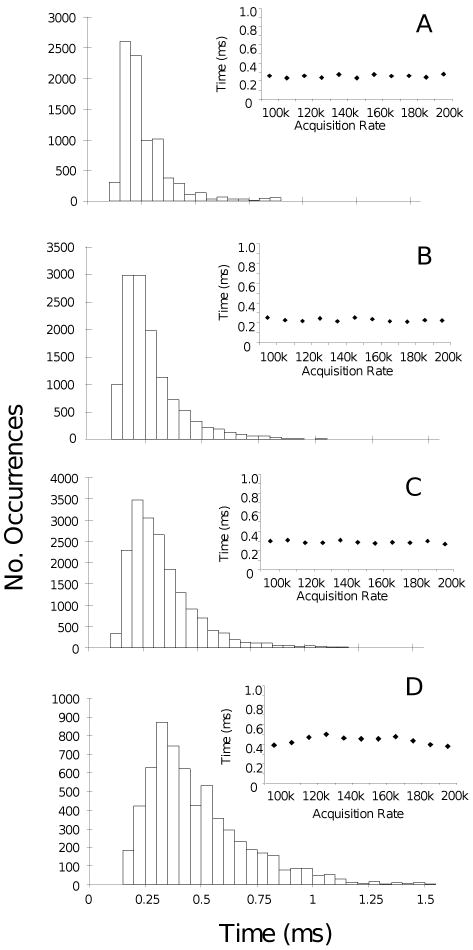
Fig. 4.
Distributions of transition times from single molecules collected at 1mM MgCl2 and 2mM ATP at100 kHz using (A) 75 × 35 nm, (B) 87 × 36 nm, (C) 90 × 46 nm, and (D) 91 × 45 nm nanorods. (Insets) The average time of each distribution for each nanorod preparation, respectively, as a function of data acquisition rate.

