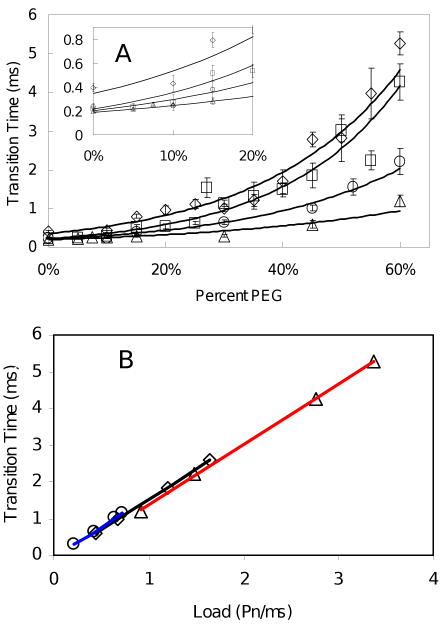
Fig. 5.
Transition times as a function of PEG-400 concentration and nanorod size at 1mM MgCl2 and 2mM ATP. (A) Average transition times as a function of PEG-400 concentration measured using 75 × 35 nm (▵), 87 × 36 nm (○), 90 × 46 nm (□) and 91 × 45 nm (◊) nanorods. (Inset) Expansion of data between 0% and 20% PEG-400 shows that the transition times for the three smallest nanorods converge to a single value of ∼250 μs. (B) Transition times plotted as a function of increasing nanorod size at fixed PEG-400 concentrations. Lines are the linear best fit for 30% (blue), 45% (black), and 60% (red) PEG-400.

