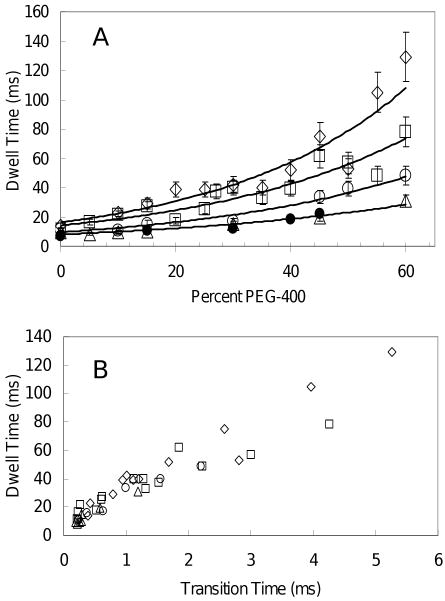
Fig. 7.
(A) Average dwell times of F1 as a function of percent PEG-400 using 75 × 35 nm (▵), 87 × 36 nm (○), 90 × 46 nm (□) and 91 × 45 nm (◊) nanorods at 1mM MgCl2 and 2mM ATP. The inverse of the kcat from bulk ATPase measurements (●) from Figure 1. (B) Linear correlation between the transition time and dwell time (correlation coefficient = 0.935) for 75 × 35 nm (▵), 87 × 36 nm (○), 90 × 46 nm (□) and 91 × 45 nm (◊) nanorods.

