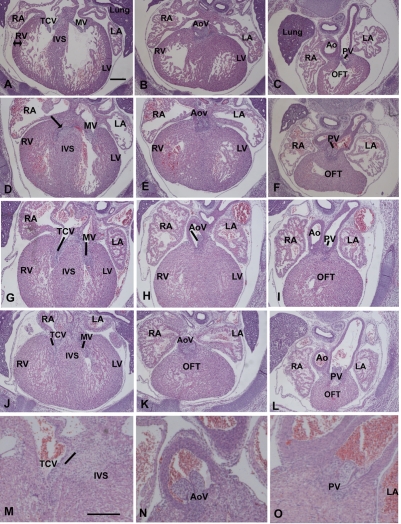
Fig. 8.
Pathology of HCy-exposed E15.5 mouse hearts displaying abnormal echo patterns. The panels in the left column depict AV valves (TCV, tricuspid valve; MV, mitral valve); the middle column shows aortic valves (AoV); and the right column shows pulmonary valves (PV). (A–C) A control heart. (D–F) An embryo with AV valve regurgitation. (G–I) An embryo displaying SL and AV valve regurgitation upon echocardiography. (J–L) The echo patterns for this embryo defined pulmonary stenosis. (M–O) Higher magnification of valves in hearts showing valve regurgitation upon echocardiography of an AV valve (M) and SL valves (N,O). RA, right atrium; RV, right ventricle, LA, left atrium; LV, left ventricle; IVS, interventricular septum; Ao, aorta; OFT, outflow tract. In all panels, the embryonic anterior is to the top. Bars, 152 μm.

