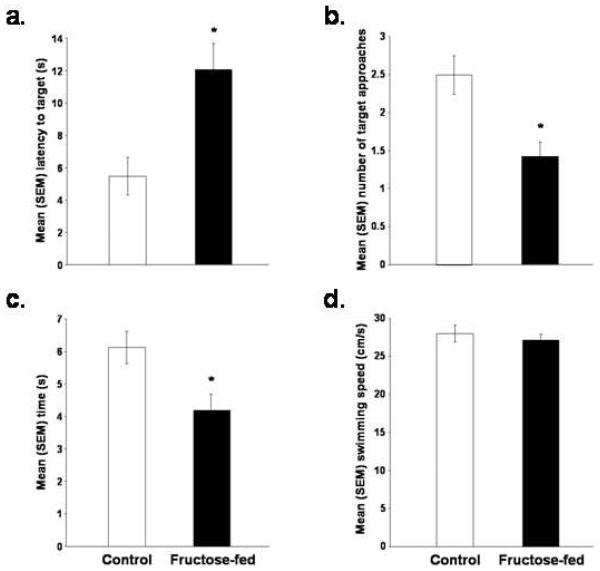
Figure 3.
The effects of eating a control or high fructose (60%) diet for 138 days on the mean (+/-) SEM (a) latency to reach the target, (b) number of target approaches, (c) amount of time spent in the target quadrant and (d) swimming speed during the spatial water maze retention test (*p < 0.05 vs. control rats).

