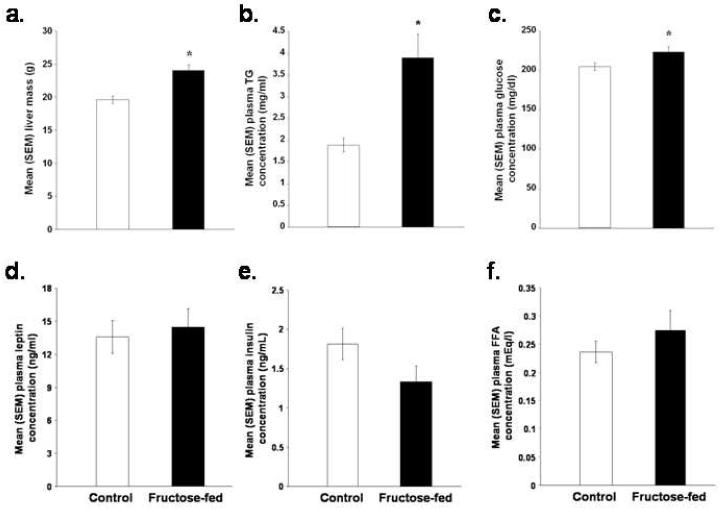
Figure 4.
Mean (+/-) SEM (a) liver mass, (b) plasma TG concentrations, (c) plasma glucose concentrations, (d) plasma leptin concentrations, (e) plasma insulin concentrations and (f) plasma FFA concentrations of rats fed a control or high fructose (60%) diet for 138 days (*p < 0.05 vs. control rats).

