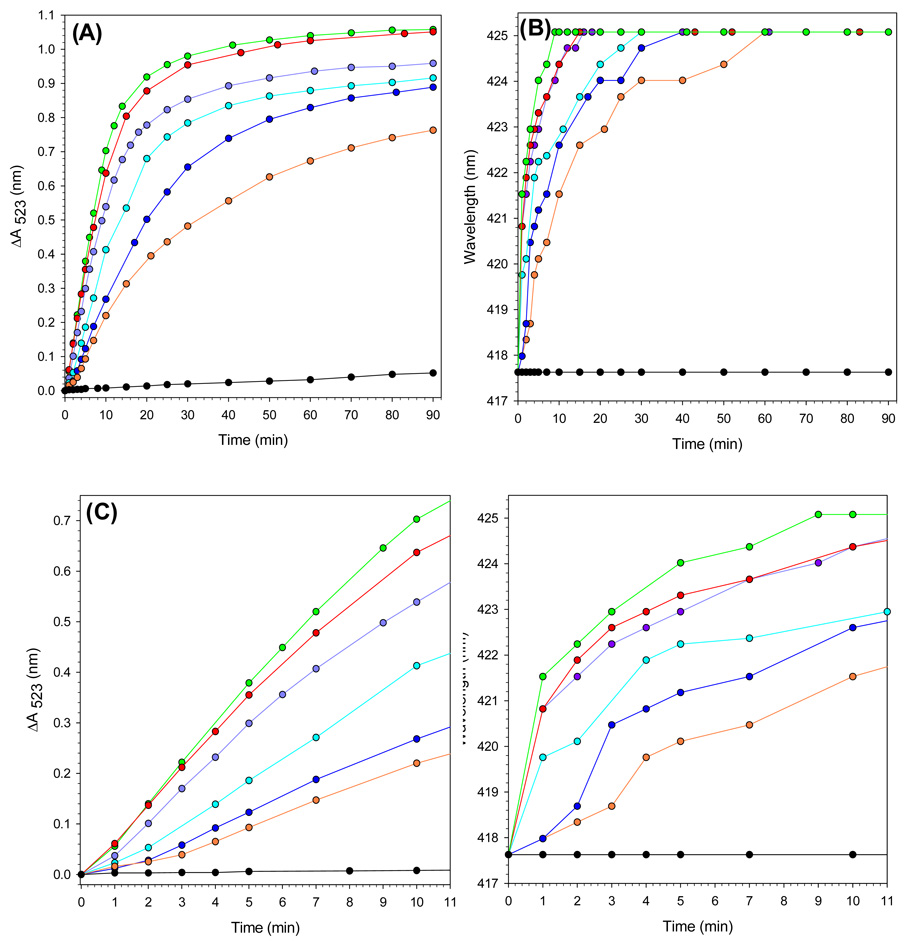
Figure 6. Effect of Bfd concentration on the time-dependent processes of iron mobilization and heme reduction.
(A) Time dependent plot of absorption intensity change measured at 523 nm upon addition of NADPH (1.5 mM ) to solutions containing 3.0 mM bipy, 15 µM FPR, 0.375 µM BfrB and apo-Bfd with Bfd/Bfrb molar ratio of 40 (green), 30 (red), 20 (purple), 15 (cyan), 10 (blue), 5(orange) and 0 (black). (B) Time dependent changes in the position of the Soret band brought about by the addition of NADPH (1.5 mM) to the solutions in figure A; 417.5 nm and 425 nm correspond to fully oxidized and fully reduced heme, respectively. (C) Zoomed view (initial 11 min) of the time dependent absorption changes corresponding to the plots in A. (D) Zoomed view of the time dependent changes in the position of the Soret band corresponding to the plots in B.

