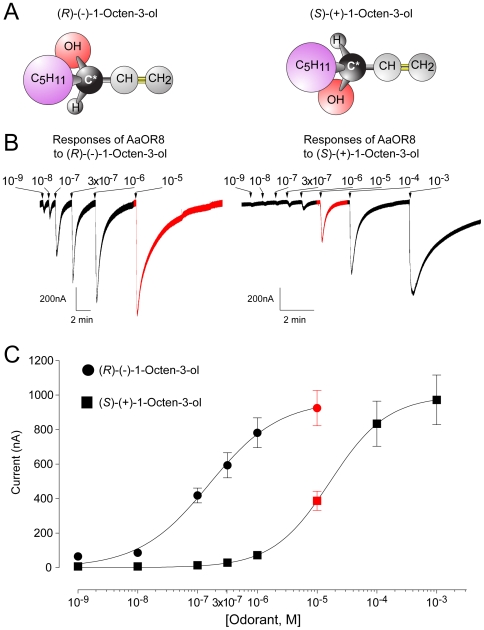
Figure 1. AaOR8 discriminates between the two enantiomers of 1-octen-3-ol.
(A) The odorant 1-octen-3-ol occurs in two configurations: (R) and (S). Asterisk indicates the chiral center. (B) Response traces of AaOR8 to each enantiomer are recorded in nano-ampere (nA). For space considerations, time scales differ. (C) Concentration-response plots of AaOR8 to each enantiomer of 1-octen-3-ol (n = 6). Odorant concentrations were plotted on a logarithmic scale. Each point represents the mean and vertical current response; error bars are s.e.m. Responses to 10−5 M 1-octen-3-ol are highlighted in red.

